This dashboard can be opened from the Home page left sidebar under Dashboards > Product Order Status.
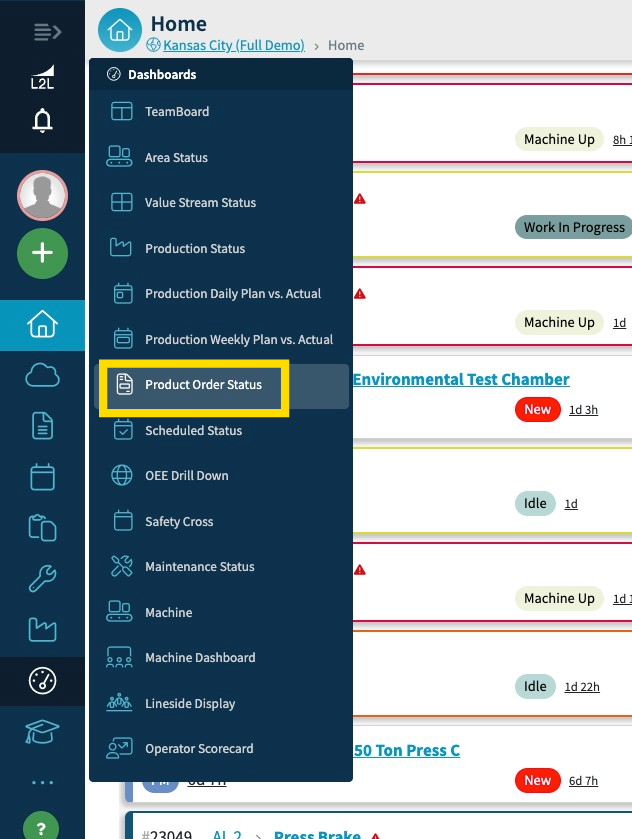
This dashboard will allow you to monitor production orders as they are being built on the production floor. The difference between this dashboard and the
Here are some features of this product order dashboard that will help you select what you want.
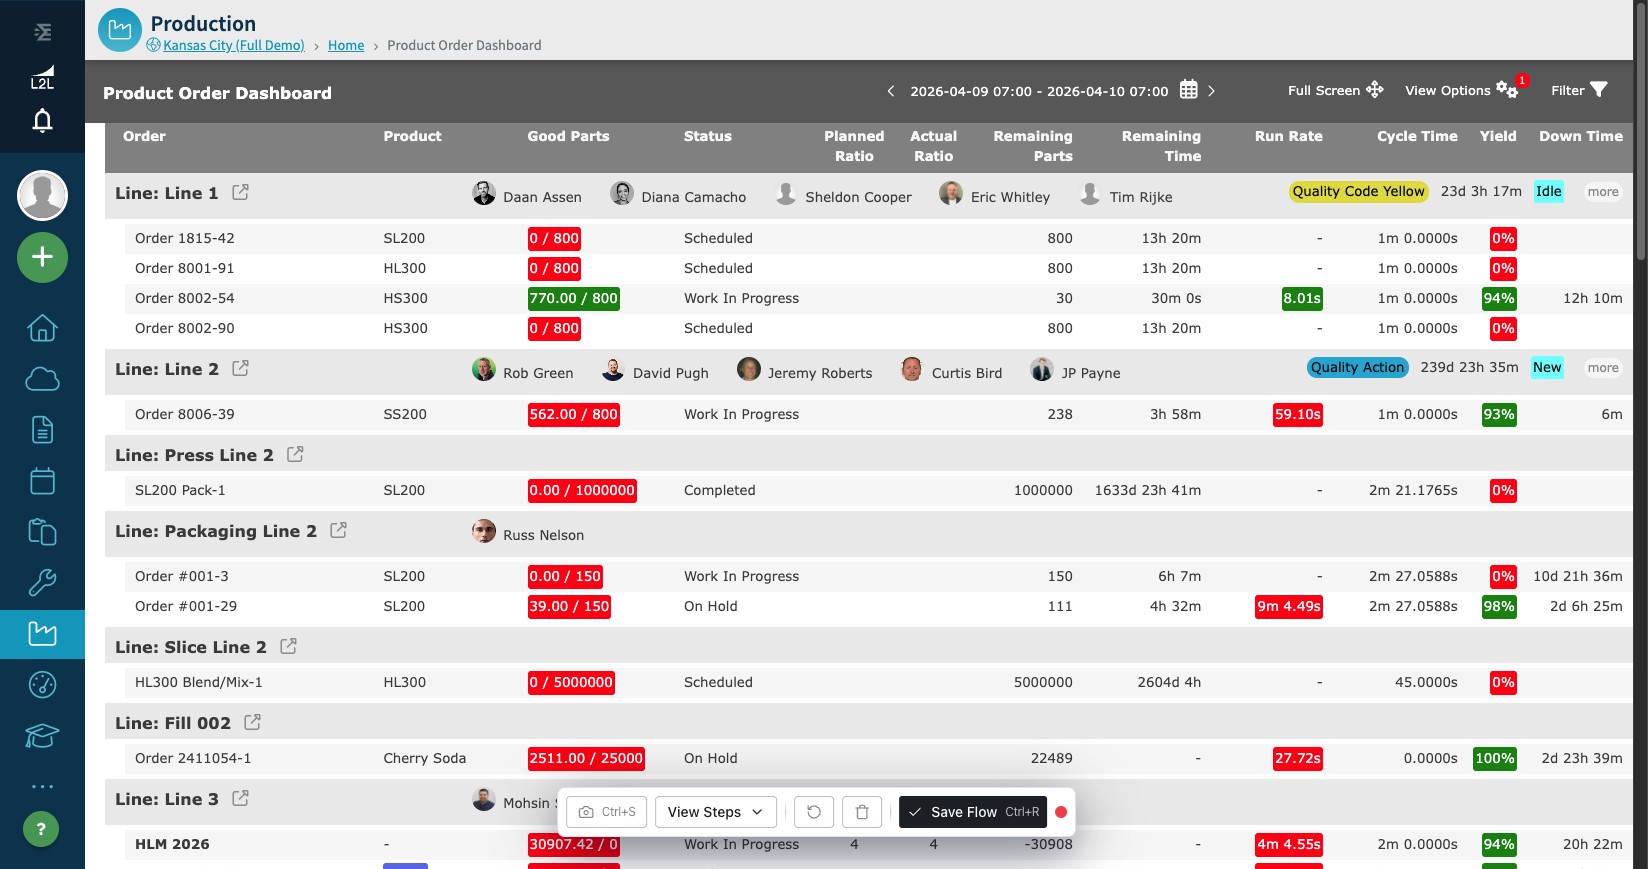
Filters: click Filter in the top right to open a panel where you can filter the dashboard by Areas, Lines, and Status.
Date Filter: The Product Order Dashboard displays data from a single production day at once. You can modify the date filter by using the date chooser at the top of the screen. The filter will include all orders that were scheduled to run on the selected date, even if it was scheduled to start before the filter date, or end after the filter date. This dashboard uses the Production Start Time for the filter boundaries.
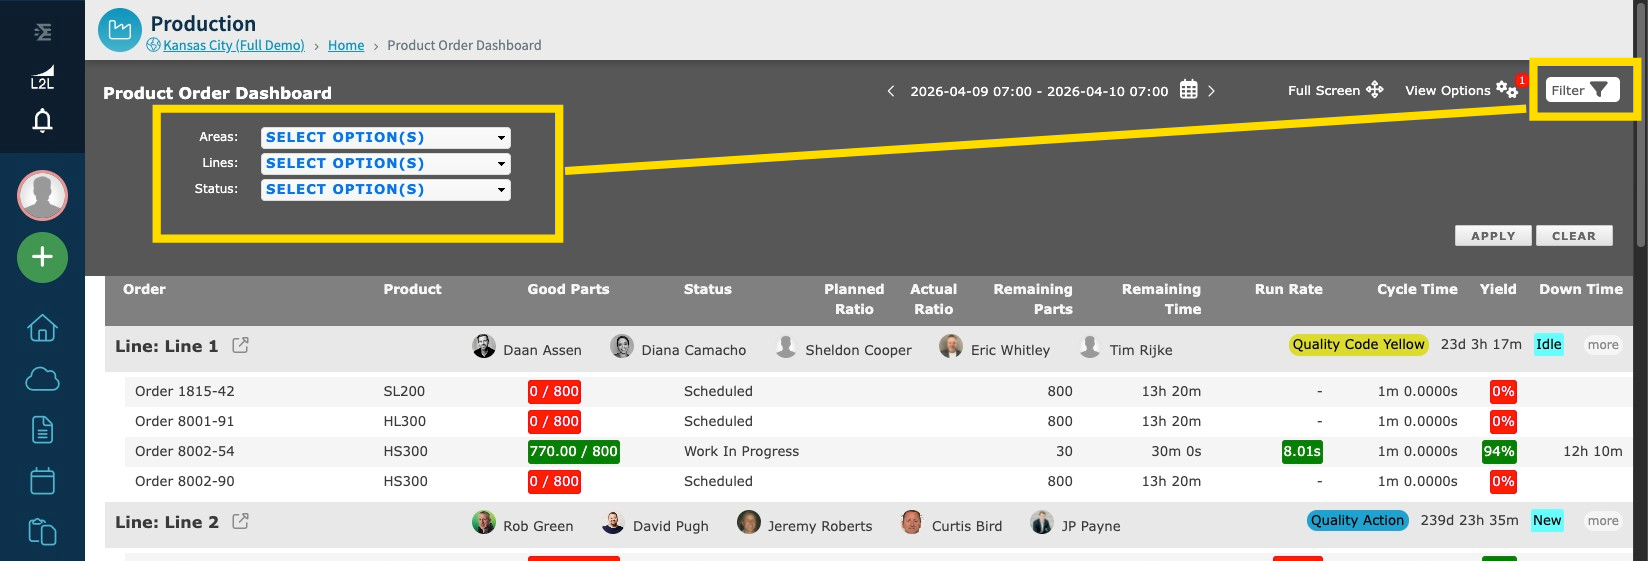
View Options: click View Options next to Filter to open a settings panel where you can choose which columns to display, select dispatch types, and set the dashboard refresh interval.
The 'more' button to the right of each Line label brings you to the Line History with a display of open Dispatches. However, we'll list the Dispatch that has been open the longest in the 'view'.
Metrics
Here’s a breakdown of the metrics in the dashboard for reference:
Run Rate
Group: Calculated as ((sum([order planned production minutes]) * 60) / (sum([order actual]) + sum([order scrap]))) * group actual ratio
Order: ([build sequence production minutes] * 60) / ([build sequence built qty] + [build sequence scrap qty])
[build sequence production minutes] is a sum of pitch planned production minutes - down time
Yield
This is calculated as: Actual / (Actual + Scrap)—you’ll also find this shown as the Production Quality/Yield Percentage in the production settings. Both Actual and Scrap values are sourced from the Build Sequence.
Planned Ratio
Group: The sum of all order/build sequence ratios.
Order: Derived directly from the order/Build Sequence.
Actual Ratio
Group: The sum of actual ratios across order/build sequences.
Order: Pulled from the Product Order, which is set on the pitches.
Remaining Parts & Remaining Time
Remaining parts are calculated based on the Order/Build Sequence, and this figure incorporates “adjusted parts” as well.
Remaining time is determined by multiplying the cycle time by the remaining parts.