TeamBoard
Last updated: June 19, 2026
L2L TeamBoard is a digital dashboard to be used during Tier meetings. It follows common SQDC principles, and uses L2L data, so you can get started without a complex setup. If you would like to learn more about TeamBoard, please contact your L2L rep today!

Enabling TeamBoard
- Talk with your account representative to purchase TeamBoard.
- If you have purchased TeamBoard, a member of the L2L Team likely has already enabled or may further enable this for your site.
- If you have purchased TeamBoard, you use the production module, and this has not yet been set up by a member of the L2L team, enabling is very easy if you'd like to try yourself.
- Please note: If you are not using the production module, TeamBoard is not intended for you as the production module is a prerequisite to enable functionality.
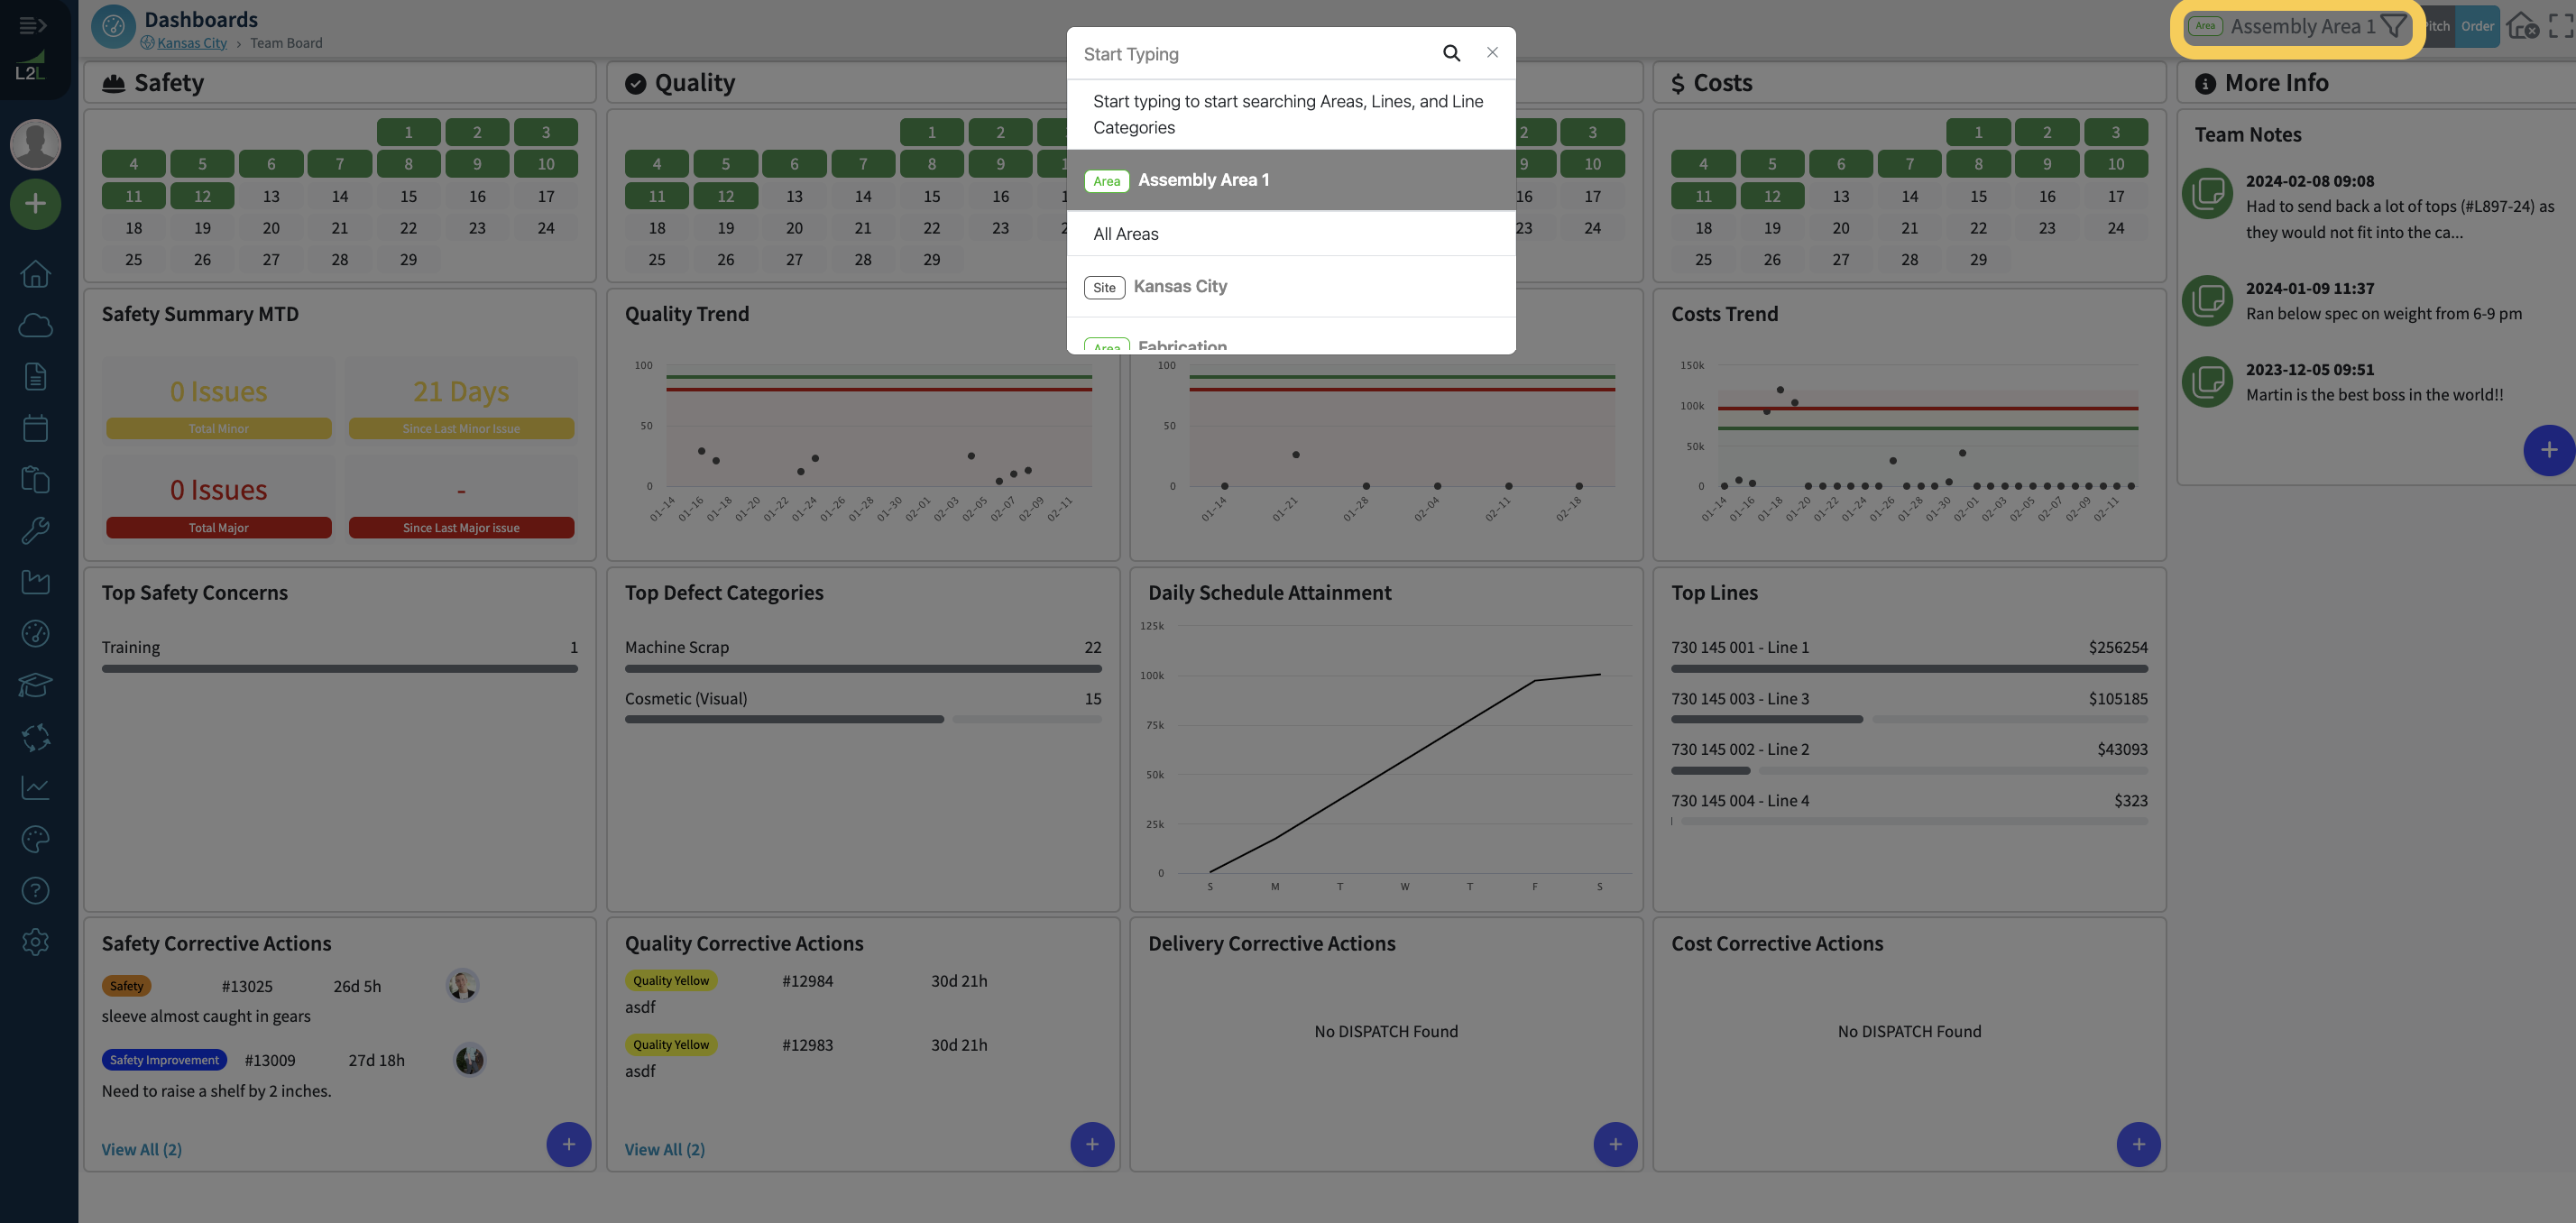
Filters
- You'll find a filter icon on the top of the TeamBoard that allows you to search and/or select from site, areas, lines, or line categories.
- Line categories are used to accommodate those levels of hierarchy between line and area and between area and site.
- For example, if I have a supervisor in charge of 3 lines, they might have their own line categories to see all the data in one spot. You may do the same thing for multiple areas/lines.
- Use the multi-level filters to personalize to your org chart to instantly start stand-up meetings. Zoom into an area or specific line to focus your attention on what’s most important to you using the top filters to look at shop floor from whichever level you’d like. You may personalize the reporting structure in L2L to reflect your own org structure that way you can sort by manager to kick off stand up meetings very easily.
- The house icon to the right of the filter will let you set this page as the home page. This is useful for setting this page as a Dashboard on TVs or Computers throughout the Plant.
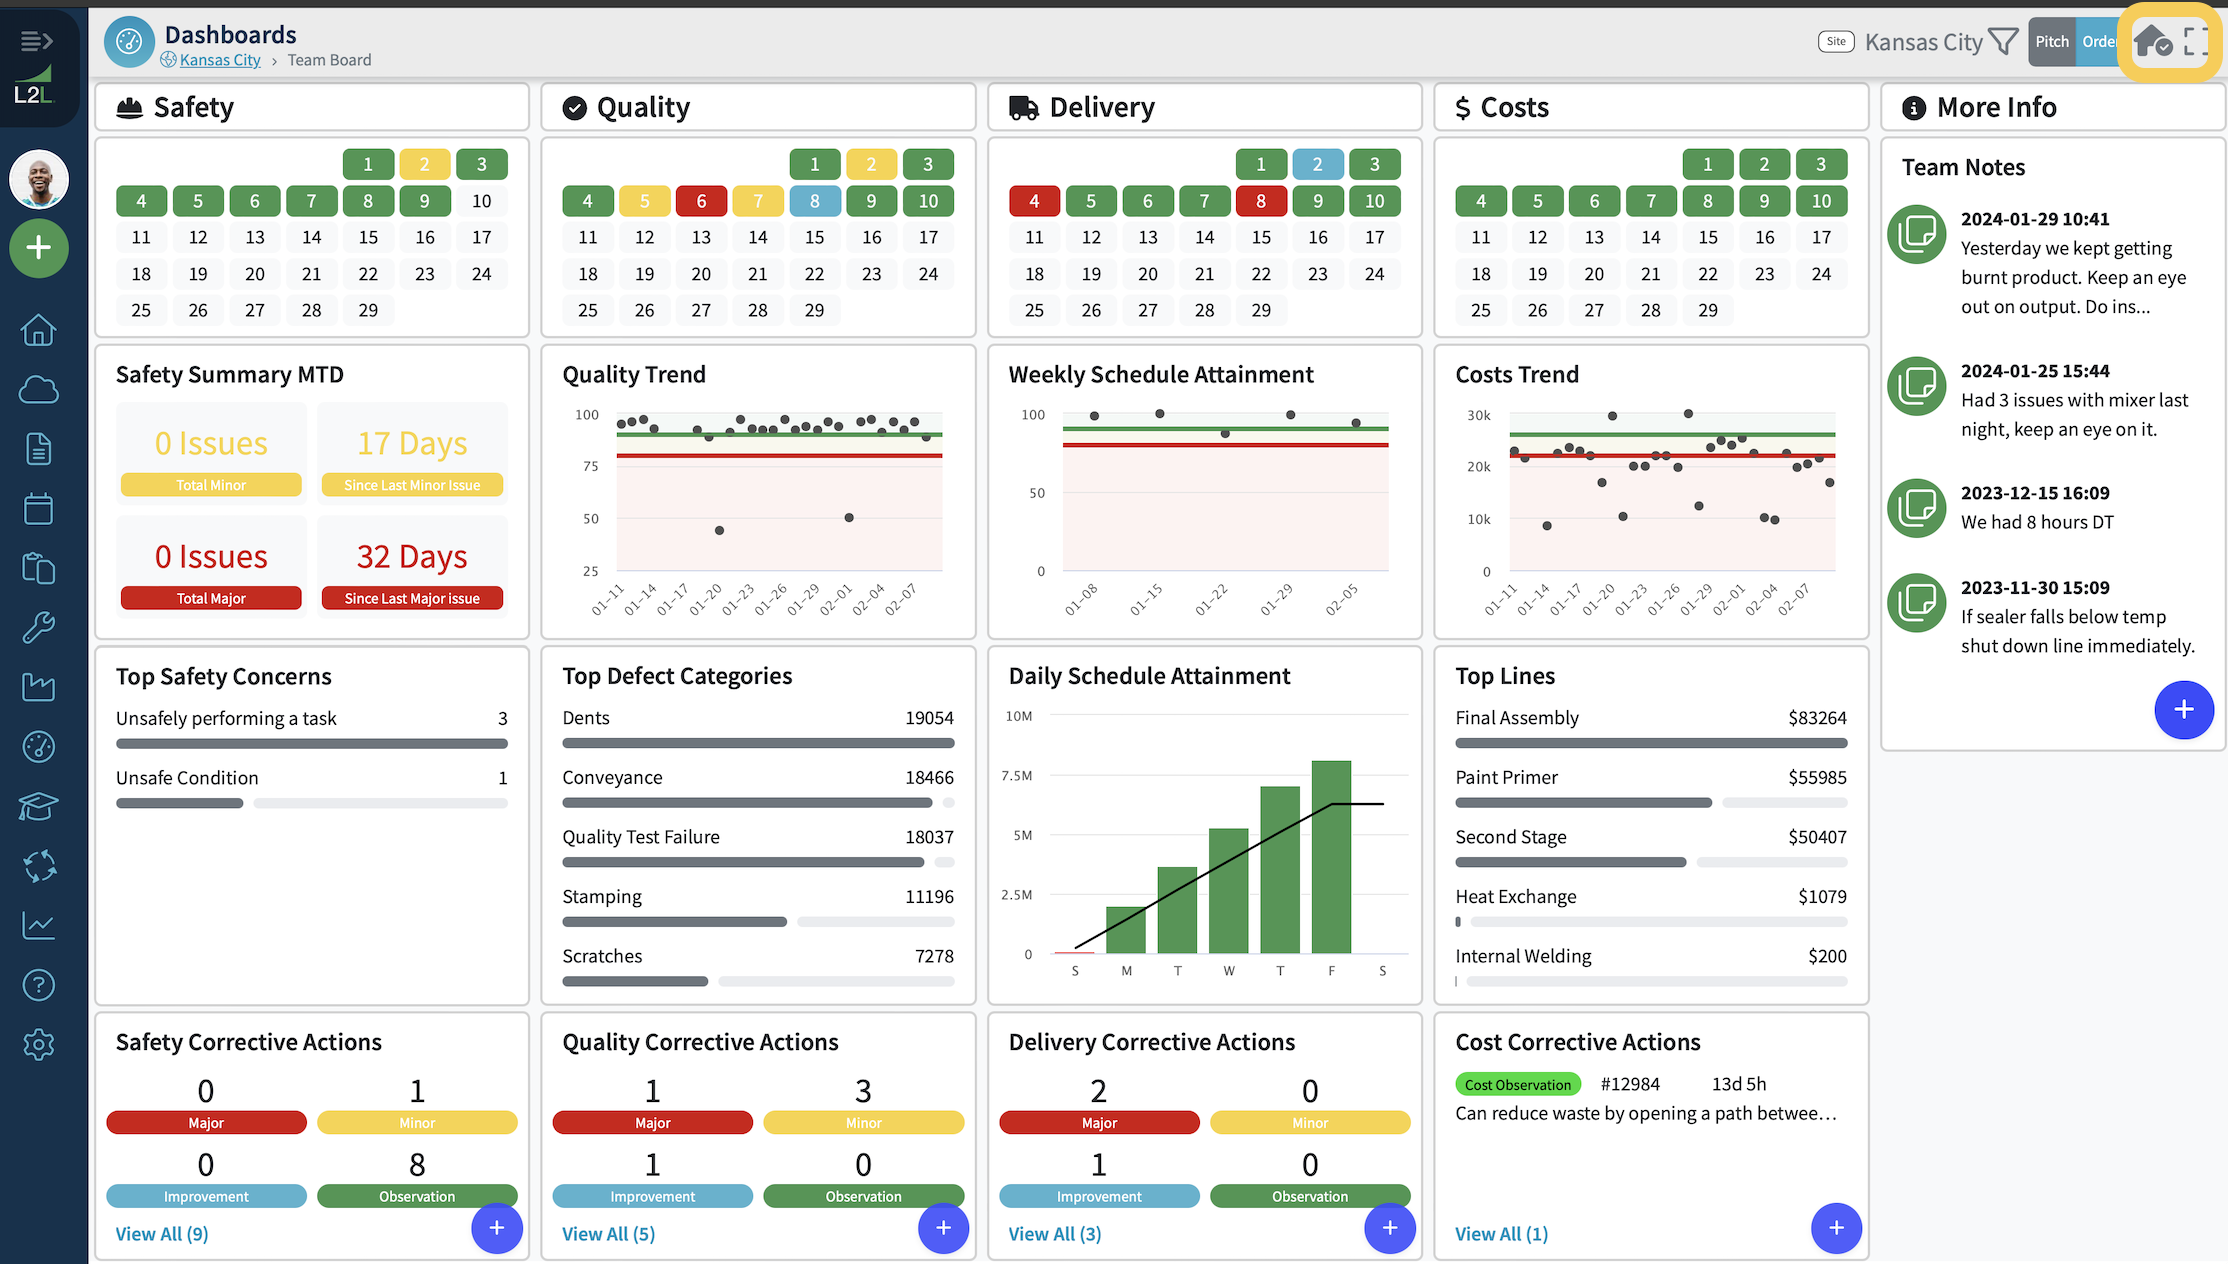
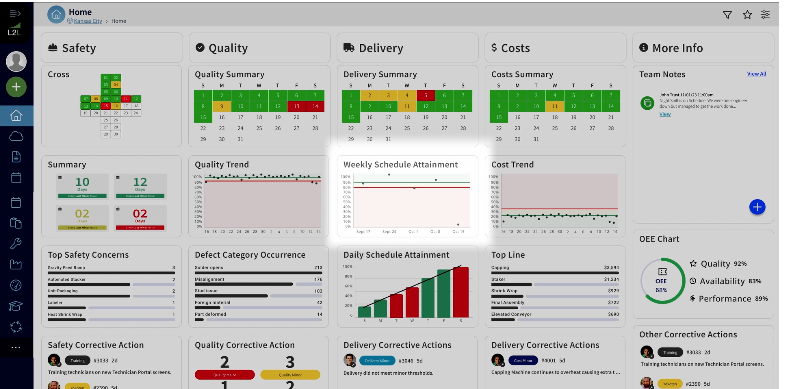
Safety Column
Calendar widget displays the current month.
Colors are coded according to the following conditions. Colors listed in order of priority:
- Red: Day has a “red” dispatch for that day, defined by the Safety Major Dispatch Category.
- Yellow: Day has a “yellow” dispatch for that day, as defined by the Safety Minor Dispatch Category.
- Blue: Day has a “blue” dispatch for that day, as defined by the Safety Improvement Dispatch Category.
- Green: Current day or day in the past, no red, yellow, or blue for that day. Dispatches with a Safety Observation Dispatch Category will remain green.
- White: Date in the future.
Safety Summary MTD
This widget gives you a total number of Major vs. Minor Dispatches during the given month and the days since the last Dispatch.
Top Safety Concerns
The top Reason Codes for the Safety Dispatches will appear here along with the count.
Safety Corrective Actions
Dispatches with a Safety Dispatch Type Category will be displayed here with a brief description and the number of days open. This widget only shows the 2 most recent Dispatches, but allows you to open a new page to view the Dispatch History with the rest.
Safety Column Setup
- In order to use top safety concerns, you need to use reason codes for safety dispatches as you will categorize safety concerns using these reason codes.
- Choose a Dispatch Type Category for your existing Dispatches, or create new Dispatch Types to map to the following Dispatch Type Categories: Safety Observation, Safety Improvement, Safety Minor, or Safety Major. You can read more about this in this article: Dispatch Type Setup.
Quality Column
Calendar widget displays the current month.
Colors are coded according to the following conditions. Colors listed in order of priority:
- Red: Day has a “red” dispatch for that day, defined by the Quality Major Dispatch Category.
- Yellow: Day has a “yellow” dispatch for that day, as defined by the Quality Minor Dispatch Category.
- Blue: Day has a “blue” dispatch for that day, as defined by the Quality Improvement Dispatch Category.
- Green: Current day or day in the past, no red, yellow, or blue for that day. Dispatches with a Quality Observation Dispatch Category will remain green.
- White: Date in the future.
Quality Trend
The quality trend is a rolling 30 day trend displaying your yield. Hovering over the dots will bring up a percentage for that date. If there are no dots present, production did not run on that day.
Top Defect Categories
The top Defect Categories for the Quality Dispatches will appear here along with the count. *Note: You must be using Defect Categories (not just Defect Types) in order to see data on this widget.
Quality Corrective Actions
Dispatches with a Quality Dispatch Type Category will be displayed here with a brief description and the number of days open. This widget only shows the 2 most recent Dispatches, but allows you to open a new page to view the Dispatch History with the rest.
Quality Column Setup
- Choose a Dispatch Type Category for your existing Dispatches, or create new Dispatch Types to map to the following Dispatch Type Categories: Quality Observation, Quality Improvement, Quality Minor, or Quality Major. You can read more about this in this article: Dispatch Type Setup.
- You'll need to create Defect Type Categories if you don't currently have them. You can read more about Defect Type Categories in this article: Defect/Scrap Categories, Types & Classification.
Delivery Column
Calendar widget displays the current month.
Colors are coded according to the following conditions. Colors listed in order of priority:
- Red: Day has a “red” dispatch for that day, defined by the Delivery Major Dispatch Category.
- Yellow: Day has a “yellow” dispatch for that day, as defined by the Delivery Minor Dispatch Category.
- Blue: Day has a “blue” dispatch for that day, as defined by the Delivery Improvement Dispatch Category.
- Green: Current day or day in the past, no red, yellow, or blue for that day. Dispatches with a Delivery Observation Dispatch Category will remain green.
- White: Date in the future.
Note: This widget has the ability to click and drill down to Line Views.
You may also use the Widget Drill-in capability to take a closer look at acute problems on your shop floor. This Drill-in capability will allow you to focus on a single widget with greater detail and granularity. You may use this if you have a particularly acute issue that needs to be quickly researched and start your problem solving.
You will have two different options to choose from for the Delivery Widget, you can choose to view the Schedule Attainment or the Production Trend simply by clicking on either Pitch or Order at the top of the screen.
Order: Schedule Attainment (This applies to order-based planning.)
Pitch: Production Trend (This applies to pitch-based planning.)
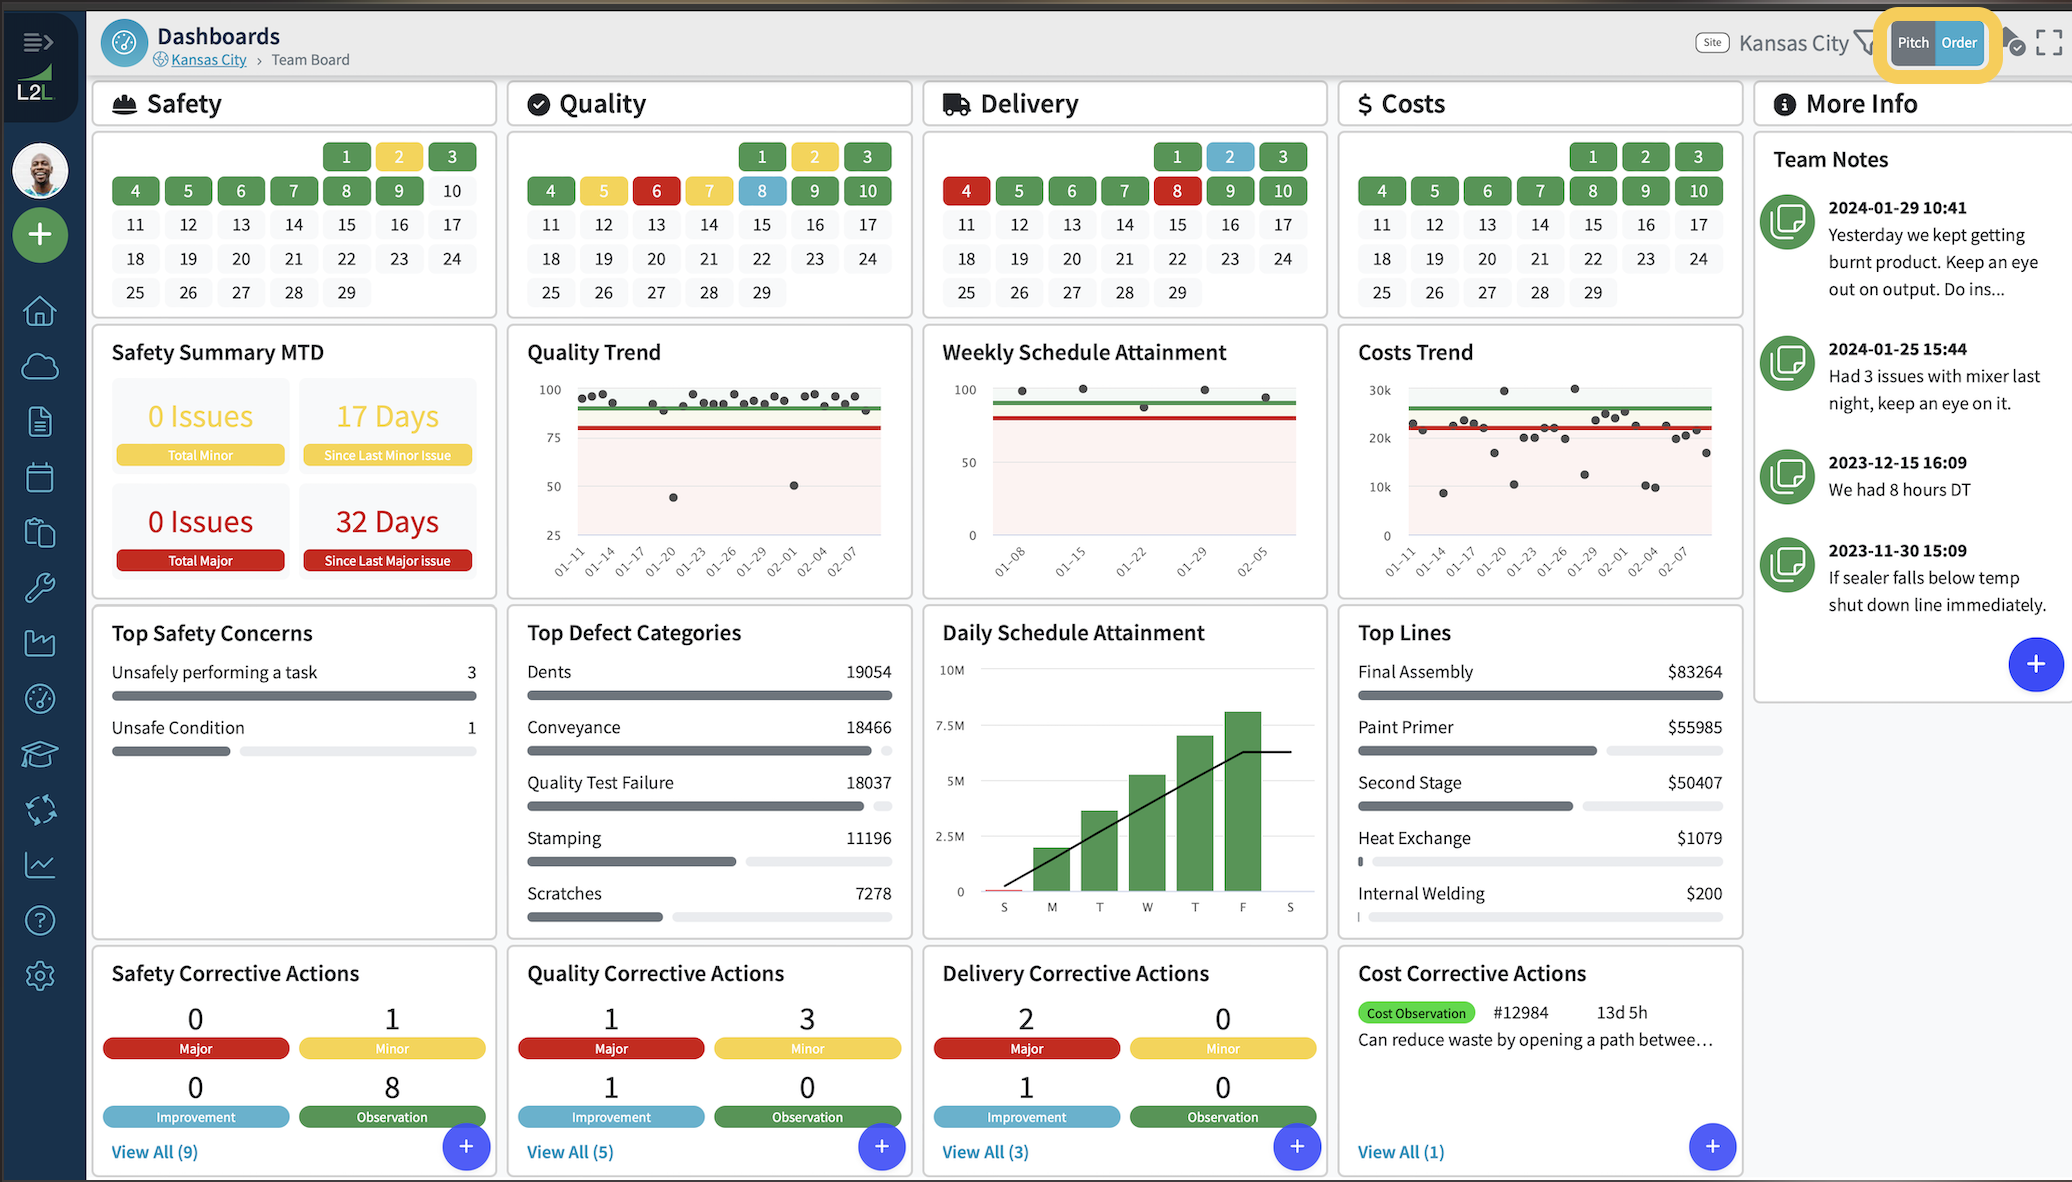
Schedule Attainment
Personalize widgets to see your unique schedule.
In the Delivery Column, schedule attainment is a new widget that shows you how you’re meeting your weekly customer order commitment.
Weekly Schedule Attainment
This widget calculates a 5-week planned vs. actual for product orders. The actual parts will be attributed to the sum of the pitch actuals for the production week, while the planned parts will come from the sum of the build sequence order quantity where the scheduled date is within the production week displayed.
*Note: If you have an order that spans a weekend, it would be best to split the order into build sequences that avoid the weekend (if you aren't running during that time).
Daily Schedule Attainment
This widget shows the weekly planned parts and the daily attainment of the plan. The line represents the total parts that should be built by the end of each production day, taking into account shift schedules. The bar chart represents the actual parts built each day, and will be additive across the days; i.e. actuals from Sunday are added to Monday, Monday to Tuesday, etc.

Production Trend
In the Delivery Column, Production Trend is a widget that shows you plan vs actual for customers who set demand on pitches at the beginning of each week.
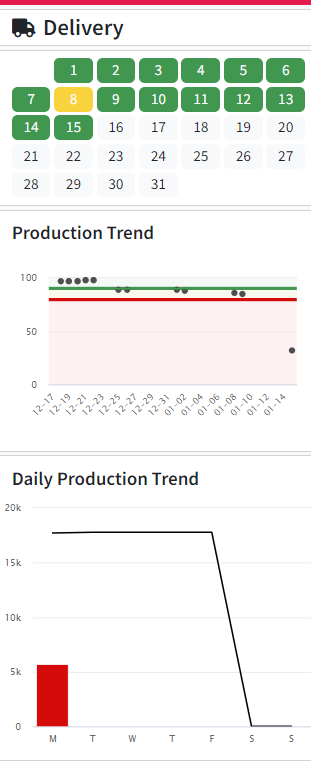
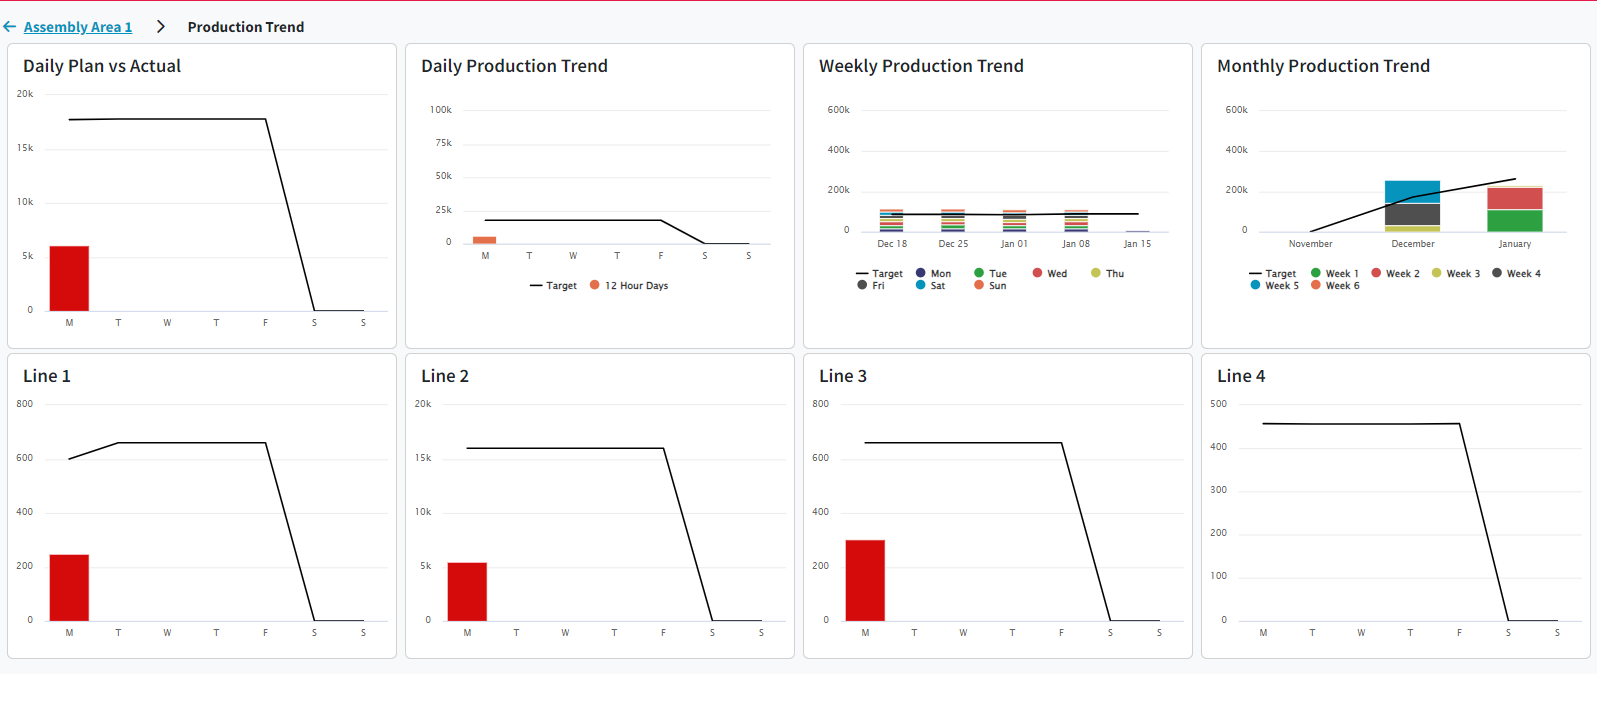
Daily Plan vs Actual
This Line will represent the cumulative pitch demand vs actual.
Daily Production Trend
The line will represent the sum of the pitch demand for each day and the stacked bar will represent the sum of the pitch actual each day broken out by shift.
Weekly Production Trend
The line will represent the sum of the pitch demand for each week and the stacked bar will represent the sum of the pitch actual each week broken out by day.
Monthly Production Trend
The line will represent the sum of the pitch demand for each month and the stacked bar will represent the sum of the pitch actual each week broken out by week.
Delivery Corrective Actions
Dispatches with a Delivery Dispatch Type Category will be displayed here with a brief description and the number of days open. This widget only shows the 2 most recent Dispatches, but allows you to open a new page to view the Dispatch History with the rest.
Delivery Column Setup
- For Delivery Setup you will either need to be setting weekly demand or using weekly product orders because trend charts are based off of the current week.
- You may have a mix in the plant(s) between lines that include pitches that use demand-based planning versus lines that use order-based planning.
- If you are using order widgets for order-based planning, you will need to break out orders that span over the weekend into different build sequences as Delivery will pull in build sequences with the same schedule date for a week. Delivery groups weekly orders by schedule date.
- Choose a Dispatch Type Category for your existing Dispatches, or create new Dispatch Types to map to the following Dispatch Type Categories: Delivery Observation, Delivery Improvement, Delivery Minor, or Delivery Major. You can read more about this in this article: Dispatch Type Setup.
Cost Column
Colors are coded according to the following conditions. Colors listed in order of priority:
- Red: Day has a “red” dispatch for that day, defined by the Cost Major Dispatch Category.
- Yellow: Day has a “yellow” dispatch for that day, as defined by the Cost Minor Dispatch Category.
- Blue: Day has a “blue” dispatch for that day, as defined by the Cost Improvement Dispatch Category.
- Green: Current day or day in the past, no red, yellow, or blue for that day. Dispatches with a Cost Observation Dispatch Category will remain green.
- White: Date in the future.
Costs Trend
This widget displays a sum of labor costs (using resource rate), downtime costs (using line downtime rate), spares cost (from spare requests), and external costs for all dispatches in the plant in that area for the past 30 days.
Top Lines
This widget will list the Lines with the highest costs.
Cost Corrective Actions
Dispatches with a Cost Dispatch Type Category will be displayed here with a brief description and the number of days open. This widget only shows the 2 most recent Dispatches, but allows you to open a new page to view the Dispatch History with the rest.
Costs Column Setup
- For Costs Trend chart setup, you need to make sure you have the following set up for the technicians as these four sources get pulled into the Costs Trend Widget:
- Resource costs
- Downtime costs
- Spares costs
- External costs
- Choose a Dispatch Type Category for your existing Dispatches, or create new Dispatch Types to map to the following Dispatch Type Categories: Cost Observation, Cost Improvement, Cost Minor, or Cost Major. You can read more about this in this article: Dispatch Type Setup.
Other Information
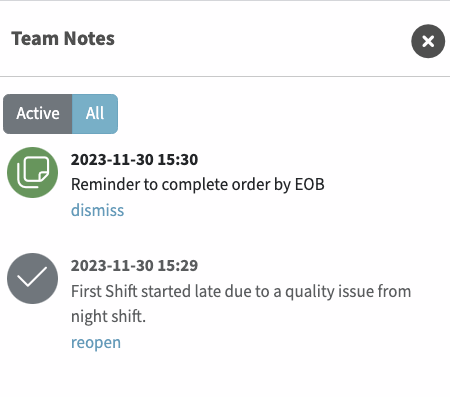
Team Notes
The Notes Widget allows users to review Handover Notes between Shifts. Notes can be added using the Plus Button. Clicking into the widget pulls up an Active vs. All View.
Shift Handover Notes - Create, dismiss, and review historical notes between shifts.
Enable smooth shift handover process by using shift handover notes. They allow you to create, sort and dismiss notes from coworkers on another shift so when you get to your line there’s no misunderstanding. You may also use historical notes to confirm what issues may be frequently occurring and may require additional attention during your shift.
- Displays all open notes
- Can be Dismissed so they are removed from the Active View.
- Dismissed notes can be viewed for 7 days from the creation date when opening the ALL tab.
- Can be reopened by navigating to the 'All' View.
- May have a hyperlink
- At this time, the percentage thresholds for color indicators in the trend graph widgets are preset and not configurable via the line setup or yield threshold settings.
These specific widget ranges (e.g., green for 90-100%, yellow for 80-90%) remain fixed, regardless of any adjustments made on your end.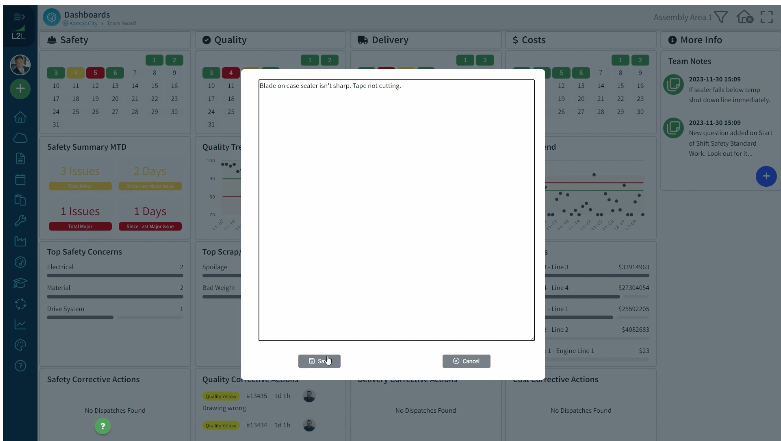

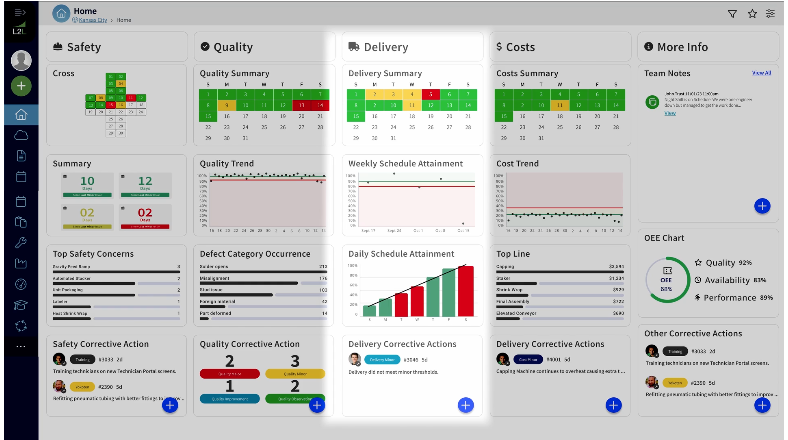
OEE Chart
There is an OEE chart you may view and click to access further data on the TeamBoard Dashboard which incorporates data from the OEE Drill Down dashboard. This includes the OEE Chart for the last 30 days as well as the Daily, Weekly, and Monthly trend graphs for further visibility and access into the Sites, Areas, Lines, and Categories.
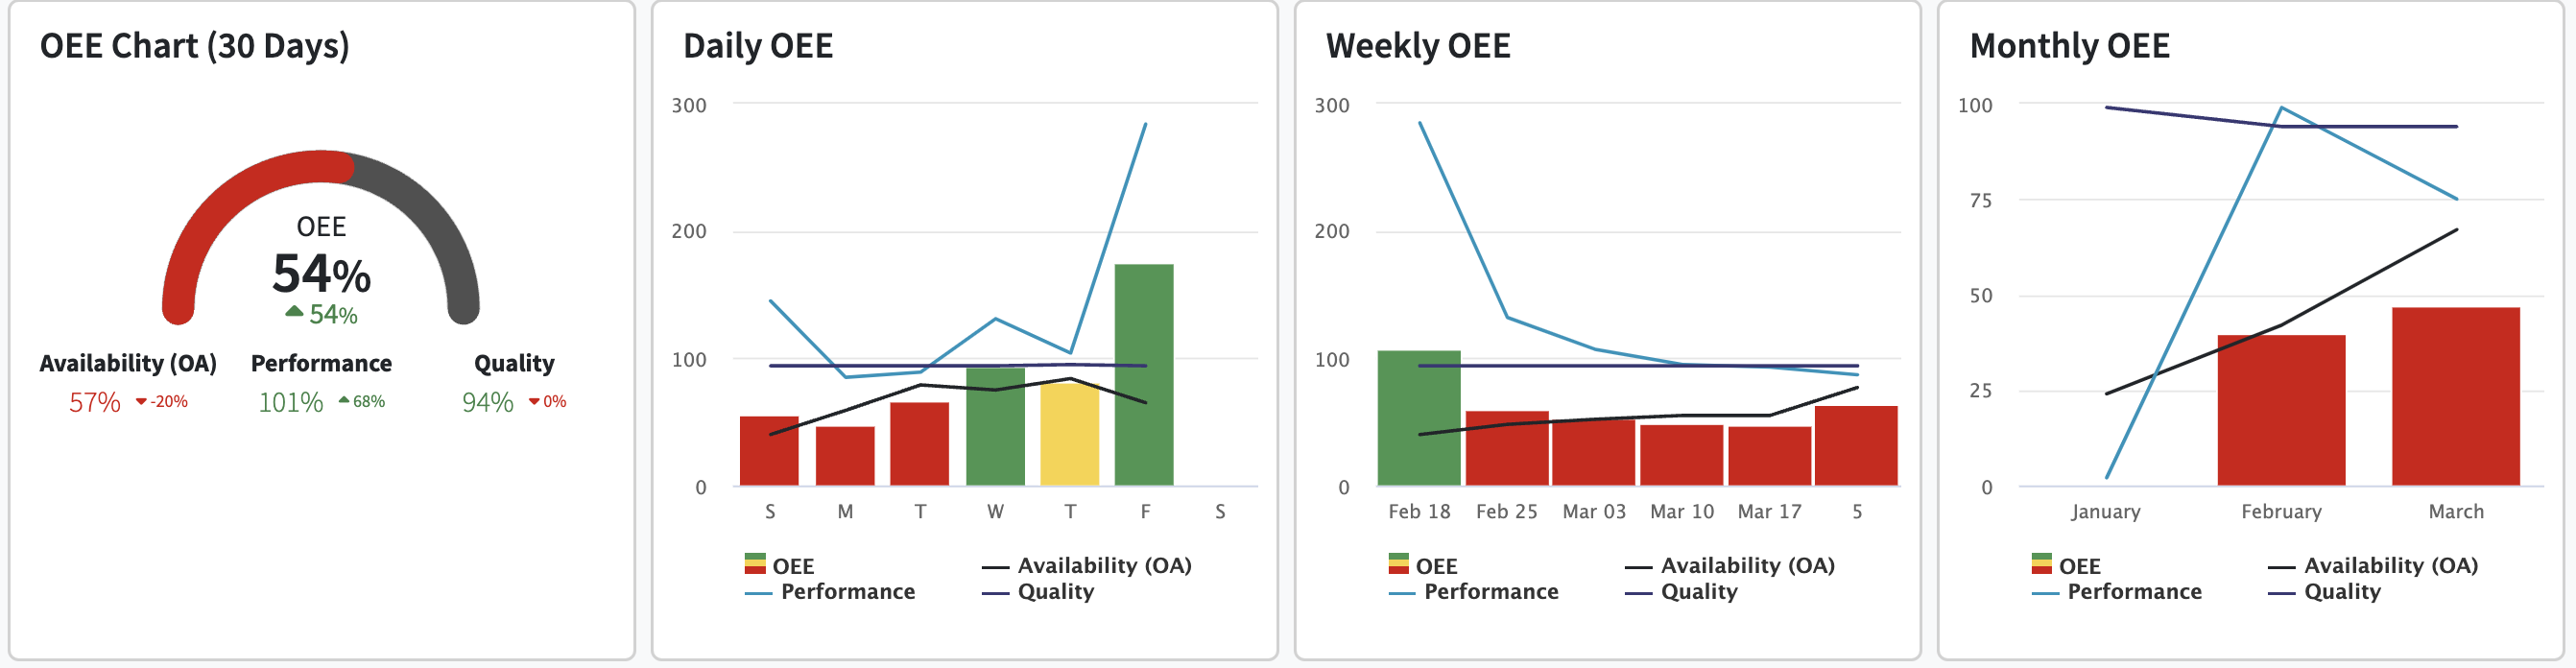
Here is a link to more information regarding the OEE Dashboard for reference.
Corrective Actions
- Dispatches with a Dispatch Type Category will be displayed here with a brief description and the number of days open. These widgets only shows the 2 most recent Dispatches, but allow you to open a new page to view the Dispatch History with the rest.
- You may notice a (+) button is available within the Corrective Actions widgets in order to quickly create corrective actions while using the board during your meetings.
