A Dashboard for the Machine!
The Machine Dashboard provides a central view of machine status, open dispatches, and related machine information for maintenance teams and other users.
Here are just a few of the things you'll be able to see and do, quickly and easily, directly from the Machine Dashboard:
- Machine Status (Up/Down, and for how long)
- Currently open Dispatches
- Create a new Dispatch
- View the Machine Image
- Availability Trend
- MTTR
- MTBF
- Downtime/Labor/Spares Costs
- Top Dispatch Types
- Top Reason Codes
- Top Actions/Components
- Top Spares Requests
Where:
- Link to the Machine Landing Page (MLP) from the Dispatch Portal
- Direct navigation by scanning QR code (attached to Machine)
- Drill-down from the Maintenance Dashboard
- Link from the Machine Detail Setup Screen
*Admins can see a Cog Wheel that will take you to the Machine Setup page.
Example Use Cases:
Manager: I’m walking by a Machine and notice that it’s not running. I scan a QR code that’s posted on the Machine and pull up a screen that shows me everything about the Machine.
Operator: I’m running one or more lines. A Machine goes down. I walk up, scan the Machine, and launch a new Dispatch for a Machine repair.
Technician: I get assigned a Dispatch to fix a Machine. I walk up to the Machine, scan the QR code, Dispatch myself to the Dispatch. I can then perform research on the Machine to see what work has been performed recently, what Spare Parts were used recently, and what recent fixes were performed: all in order to better prepare myself to fix the Machine. And I can do all of this really fast!
Open the Dispatch Portal to find the dispatch you want to review, then select the machine link to open its Machine Dashboard.
Click right on the Machine link

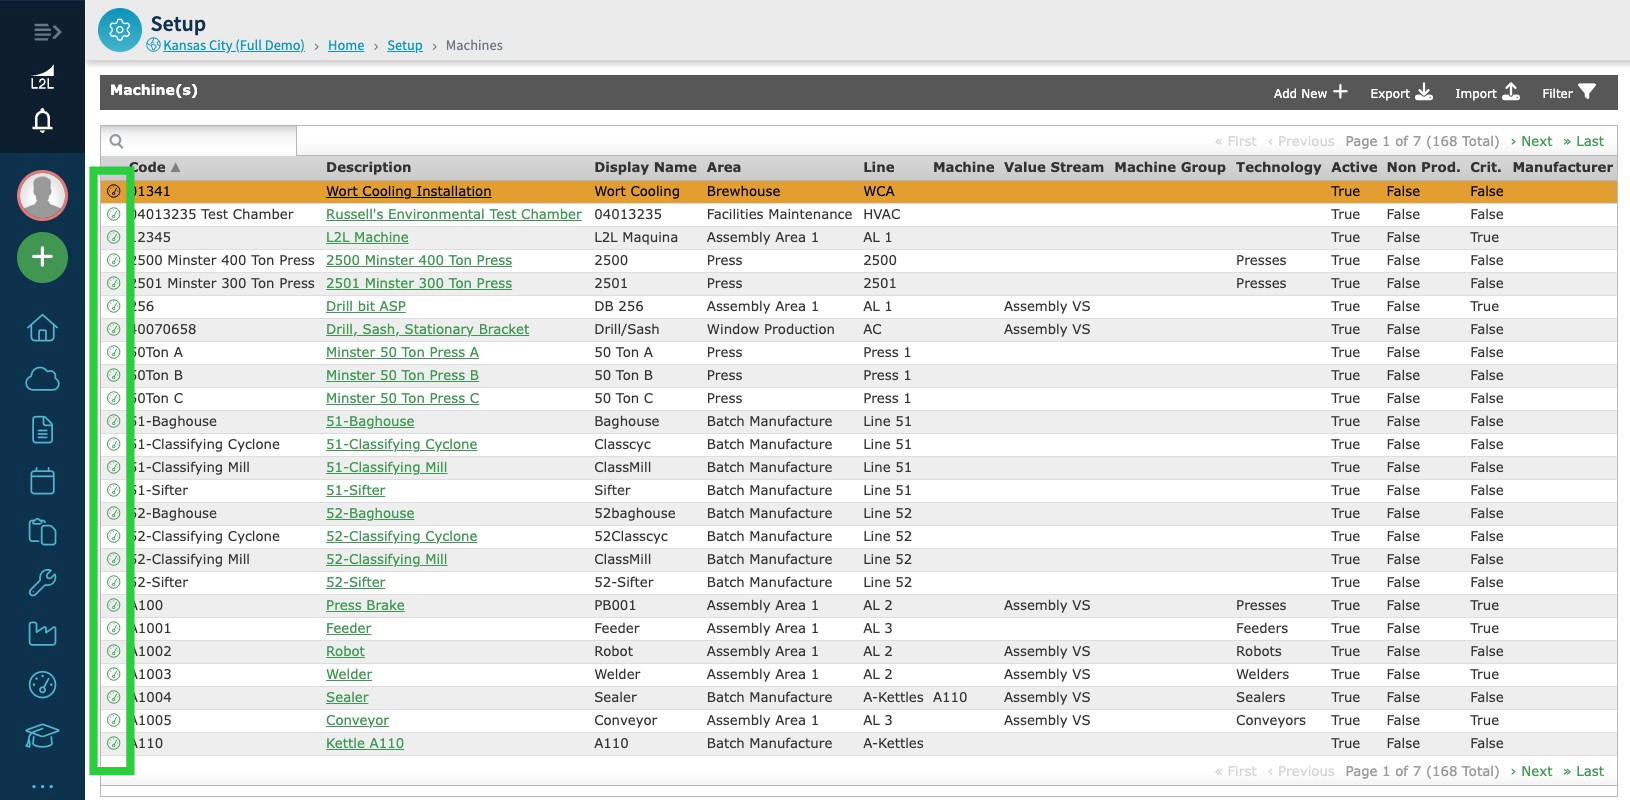
You can also go to Setup > Machines and select a machine from the list to open its Machine Dashboard.
Click on the Dashboard icon right next to the Machine Code
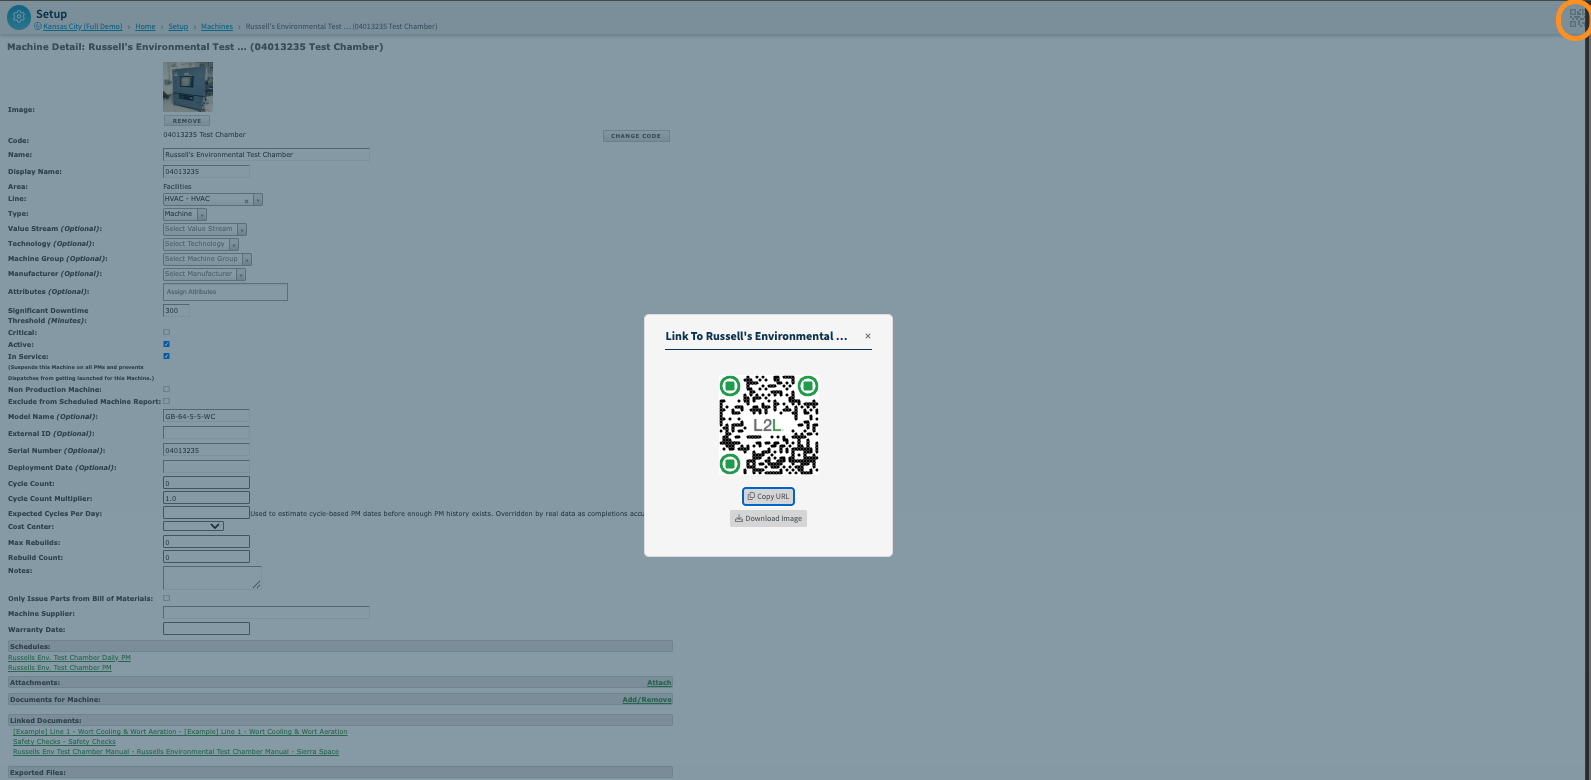
Use the QR code icon in the top-right corner of the Machine Dashboard header to open the machine QR code modal, where you can copy or download the code.
Clicking on the Dashboard icon will open the Machine Dashboard, where you can:
- See the Current Status of the Machine (Note: if the Machine has not had a down dispatch, it will show as Machine Up since the deployment date listed in the setup page)
- View recent Dispatches
- Create a new Dispatch + Dispatch button
- See the Top Spare Parts
- See what Dispatch Types have been launched against this Machine
-
Links to:
- Dispatch History, Machine History
- Spares History
-
Work Orders
- View Previous Work Orders
- Create a new Work Order
-
Scheduled Events
- View, open, edit related Schedules
- Add or create a new schedule
-
Documents
- Look up associated documents
- Add or create a new document
- Bill of Materials
-
Bill of Materials
- View Parts List
- Add or Remove parts from the Bill of Materials
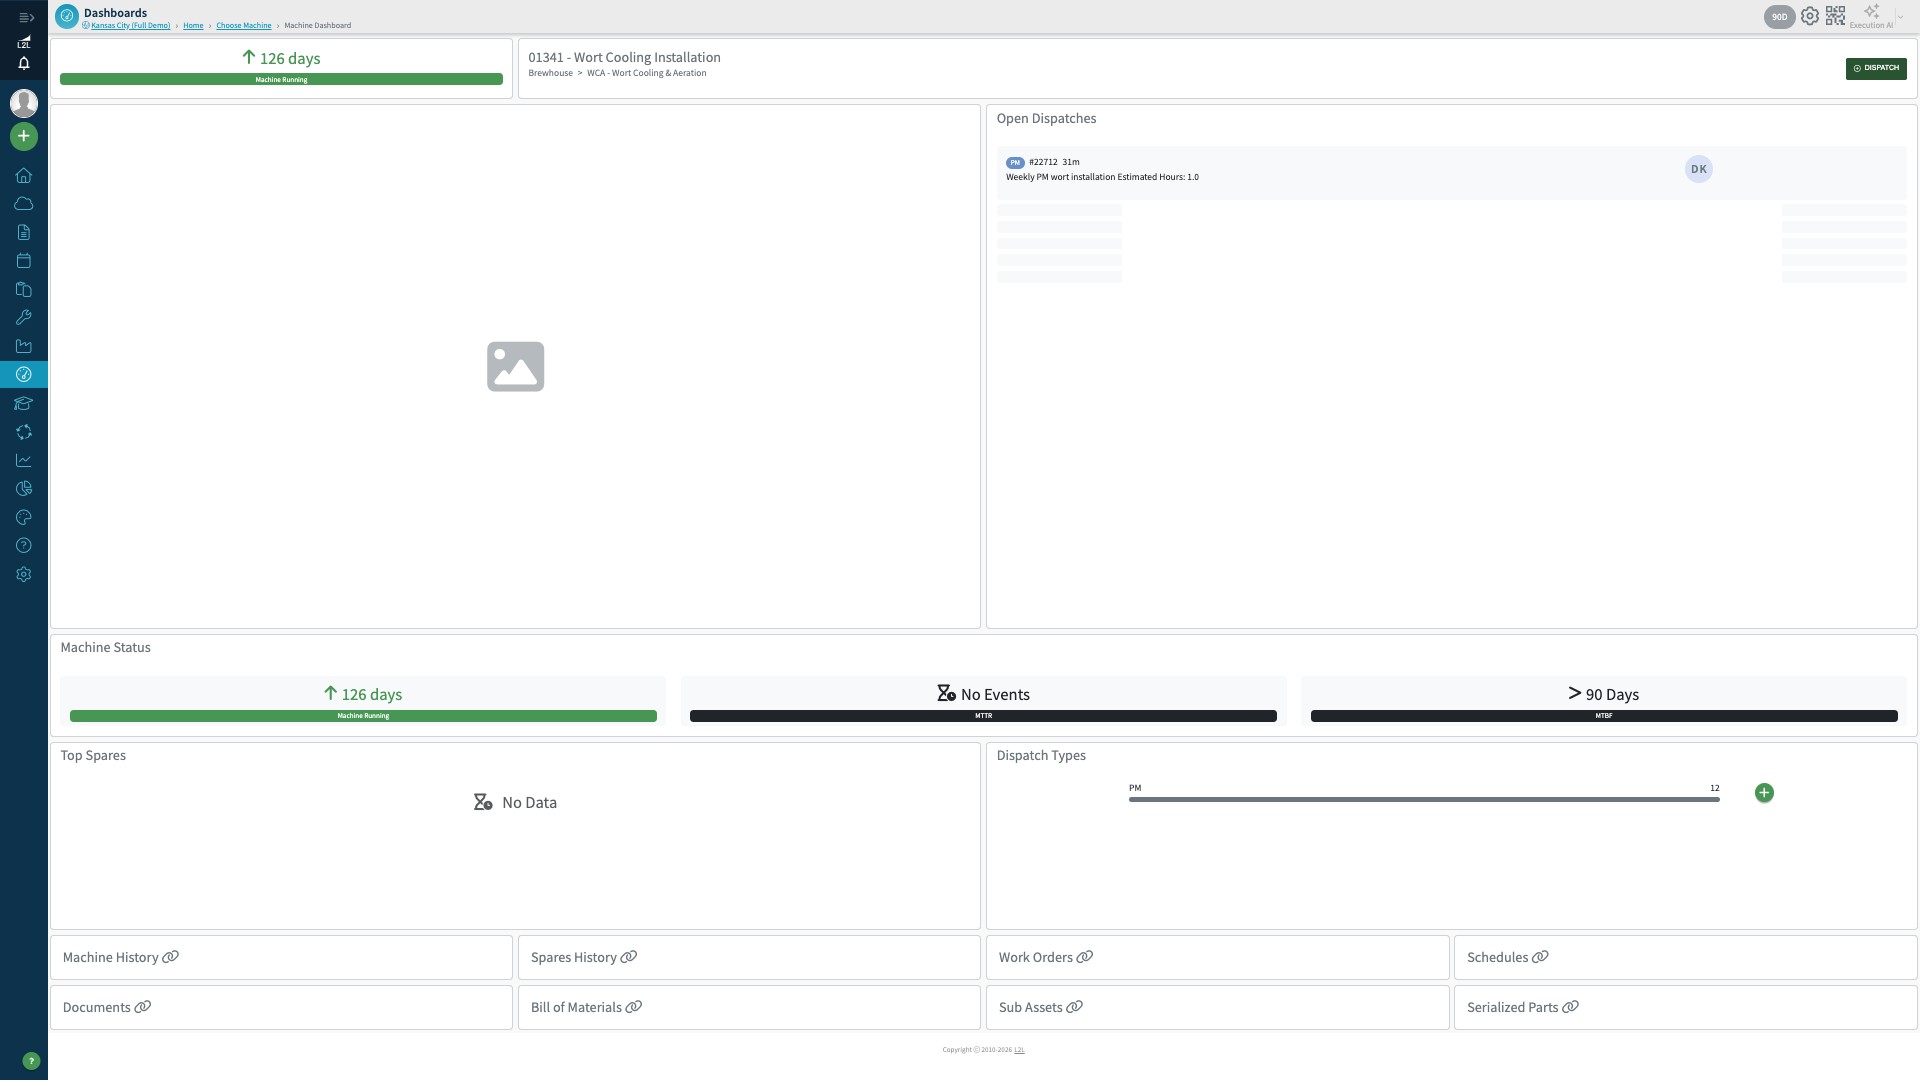
*Admins can see a Cog Wheel that will take you to the Machine Setup page.
Machine Setup page
Check out this guided tour of the Machine Dashboard. Clicking here will give you the Mobile tour.