Dispatch Summary Report
Last updated: July 13, 2026
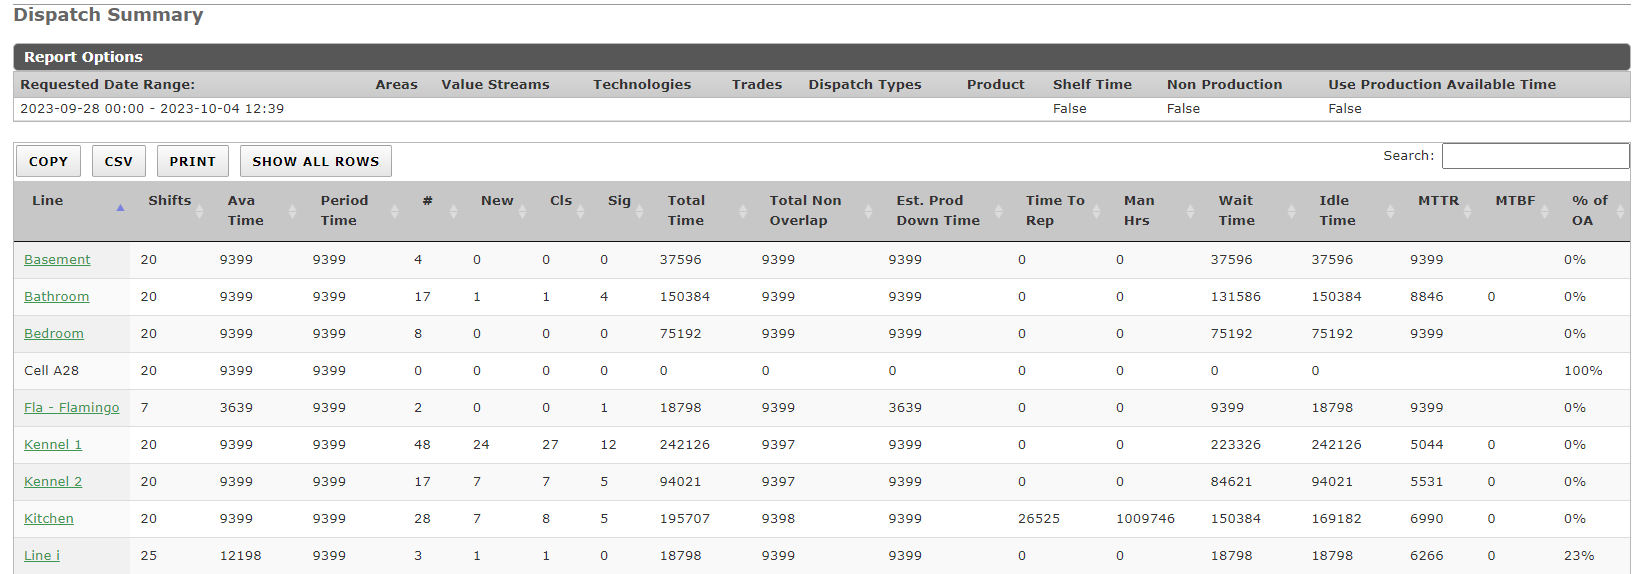
The Dispatch Summary Report provides a way to get a high-level snapshot of certain Maintenance metrics and Production metrics all in one place.
How to Use This Report
Choose the filters that match the data you want to review, such as Area, Value Stream, Technology, Trade, and Dispatch Types.
Set the reporting period by selecting a preset Date Range or by entering a specific Start Date/Time and End Date/Time.
If you want to review the same daily time window across multiple dates, select Shelf Time Per Day so the report only includes that repeating daily window.
Choose additional options as needed. Select Include Non-Production Machines to include non-production equipment, and select Use Production Available Time if you want available time and related production columns to be based on pitch records.
Run the report and review the line-level results first. Click a line to open the related Machine Summary Report for more detail.
Use the results based on the question you are trying to answer. Focus on # when you want to compare dispatch volume, Est. Prod Down Time when you want to understand production impact, Wait Time when you want to see how long events sat before the first response, Idle Time when you want to review total unattended time, and % of OA when you want to compare Overall Availability across lines.
For example, if a line shows high Idle Time and low % of OA, review its Wait Time to see how much of that unattended time happened before the first response, then click the line to drill into the machine-level detail and investigate which dispatches or machines drove the downtime.
Form Fields
Area: Limit the report to only include data for the selected Areas.
Value Stream: Select one or more Value Streams if you want to only include dispatch data for machines with the selected Value Streams.
Technology: Select one or more Technologies if you want to only include dispatch data for machines with the selected Technologies.
Trade: This filter will limit the report to only use data from Dispatches with the selected Trades.
Dispatch Types: Only pull dispatch data from the selected Dispatch Types.
Date Range: Use this to pre-populate the Start and End dates fields below.
Start Date/Time: Report will include data from Dispatches that were open after this time.
End Date/Time: Report will include data from Dispatches that were open before this time.
Shelf Time Per Day: When checked, the report limits each day in the selected date range to the daily start and end times you entered. For example, if the Start Date/Time is set to "9/1/2016 08:00" and the End Date/Time is set to "9/5/2016 17:00," the report includes data from 08:00 to 17:00 on 9/1, 9/2, 9/3, 9/4, and 9/5. This works as a repeating daily time window, which is useful when reviewing the same shift period across multiple dates. For overnight shifts, configure the date and time range to match your site's shift timing so the repeated daily window reflects the hours you want to analyze.
Include Non-Production Machines: When checked, the report includes dispatches for non-production machines in the results.
Use Production Available Time: When this checkbox is checked, the Available Time will be calculated using Pitch records instead of Resource/Production Shift records. It will also include the following columns in the report: Demand, Actual, Scrap, First time Yield.
Exclude Lines Not Associated With Resource Shift: When checked, the report excludes lines that are not associated with the selected resource shift context from the results.
Report Metrics
Below is a detailed explanation of the various columns with descriptions for the dispatch summary report.
The report results are based on the date range and filters selected in the report form.
Line:All lines with active data in the system. By clicking on each line it will give you a breakout of the machine data that makes up the lines. The value of this column is a combination of the line's abbreviation and code. If the code and the abbreviation are identical, it is only written once. Note: by clicking on a line you can view the Machine Summary Report.
Shifts: Number of shifts over selected date range based on shifts assigned on line setup.
Ava Time: Available Time. This is the total time that was available to produce parts. By default this time is calculated using the Resource/Production Shift data. If you would rather use Production Pitch available time, select the "Use Production Available Time" checkbox.
Period Time: Total Minutes in Report Date Range.
#: Total number of dispatches in the selected date range. To review the individual dispatches behind this count, use the Dispatch History report or Machine History report with matching filters. For example, you can use the Dispatch History report to view PM history for specific machines by filtering for those machines and the PM dispatch type to see all PMs over a custom date range.
New: Number of new dispatches during date range.
Cls: Number of dispatches closed during date range.
Sig: Total number of dispatches that exceeded Significant Event threshold.
Total Time: Total accumulated time. Total minutes of all dispatches from the time each dispatch was created until it was completed.
Total Non Overlap: Total unique time when a line had one or more dispatches open. This metric is only available in the line view. If dispatches overlap, the shared time is counted once rather than added together. For example, if two dispatches are open during the same 10-minute window, they contribute 10 minutes, not 20.
Est. Prod Down Time: Estimated production downtime. Estimated downtime based on Dispatches that were open during the time frame. Time is only calculated for the Dispatches that match the Dispatch Type filter. If one or more shifts are configured for a line, this metric will only calculate downtime for the time a line was scheduled to run. If "Use Production Available Time" was checked in the form, Estimated Production Down Time will not be greater than the Available Time.
Time To Rep: Time to repair. Total minutes it took to repair a machine, starting from the time a dispatch was launched, and ending when the Dispatch is marked complete.
Man Hrs: Man hours. Total minutes for all dispatches and all technicians dispatched to a line. If two resources were dispatched to a line for 2 hours, 4 hours are counted.
Wait Time: Total minutes of all dispatches while it was in "New" status prior to a resource being dispatched.
Idle Time: In this report, the Idle Time column includes total unattended time. It includes minutes when a dispatch is in New status and minutes when it is in Idle status, meaning the dispatch does not have an active resource assigned. To isolate true idle time after the first response, subtract Wait Time from the reported Idle Time.
MTTR: Mean time to repair. Average time to repair all dispatches within date range. MTTR formula: MTTR = Total Time / Total Number of Dispatches.
MTBF: Mean time between failure. Average time between dispatches. Formula: Period Time / Total Number of Dispatches.
% of OA: Overall Availability. Line OA is calculated at the line level and can reflect machine-group logic, while Machine OA is calculated for an individual machine, so the two values should not be compared as if they were interchangeable.
Line Formula = (Available time - Estimated production down time) / Available Time
Machine Formula = (Total Time Available - Total Non-Overlapping Down Time) / Total Time Available
Demand: This column is enabled when "Use Production Available Time" is enabled. This is a sum of pitch demands for the time frame. Data is gathered from pitch records.
Actual: This column is enabled when "Use Production Available Time" is enabled. This is a sum of actual parts produced during the time frame. Data is gathered from pitch records.
Scrap: This column is enabled when "Use Production Available Time" is enabled. This is the total number of parts scrapped during the time frame. Data is gathered from pitch records.
First time Yield: This column is enabled when "Use Production Available Time" is enabled.

The Totals at the bottom of the Line Level page are not averages, but a compilation of sums and metrics. For example, the Available Time in the above picture is the sum of that column, as is the Production Downtime. However, the OA metric is still calculated using the sum of the available time minus the sum of the downtime divided by the sum of the available time. It is not the average of 69+100/2.
155115 - 102570/ 155115 = .3387 x 100 = 34% (Rounded)
Wait Time vs Idle Time
Wait Time is the time a dispatch remains in New status before the first resource responds.
True idle time is unattended time after the dispatch has already been responded to and no resource is actively dispatched to the event.
Key Note: In the Dispatch Summary Report, the Idle Time column includes both Wait Time and true idle time. To calculate true idle time, subtract Wait Time from the reported Idle Time.
For example,

In this example, true Idle Time is 22.
In the summary table, the Idle Time label functions as total unattended time, even though users may think of idle time more narrowly.
How long after WIP will it switch to idle time? Triggered when no resources are actively dispatched to event after initially being in Work In Progress status. Note: Idle time and New time equal the total time event was left unattended
FAQs
Line OA and Machine OA are calculated differently. Line OA and Machine OA measure different levels of performance, so use this section as supporting detail for the distinction introduced above.
Line OA is influenced by Machine Groups.
Machine Groups allow users to alter how we calculate downtime.
To explain, if there’s a Machine Group with 10 Machines, and then a down Dispatch is launched for one of those machines for 60 mins, then we don’t have to say that the whole line was down for 60 mins. Instead, we calculate it as 1/10th of the 60 mins. So in this case, we treat it as if the Line only had 6 minutes of downtime for the OA calculation.
In the case of the machine that went down in the scenario above, the full 60 minutes of downtime is counted towards the OA for that particular machine.
Therefore, when viewing the Dispatch summary, we’re viewing data calculated per line. This means that we’re taking into account that the other 9 machines stayed running during the downtime that was experienced.
However, when you drill down on a line and see each of its Machines individually, you’re seeing the raw downtime data on a per-machine basis. So if you try to aggregate that raw data to calculate OA, you can’t just sum them, you need to also consider Machine Groups, and how each line’s downtime is calculated differently based on the number of Machines in its Machine group.
Related Links