Summary
The Time Trend Report provides a visual breakdown of dispatch activity over a defined period. By comparing Total Minutes against Average Minutes, stakeholders can identify whether dispatch durations are fluctuating due to volume changes or underlying operational shifts.
Key Insight: Use the Goal Line feature to visualize progress against specific improvement targets throughout the reporting period.
Configuration
To generate an accurate trend, users must define the scope of the data before execution.
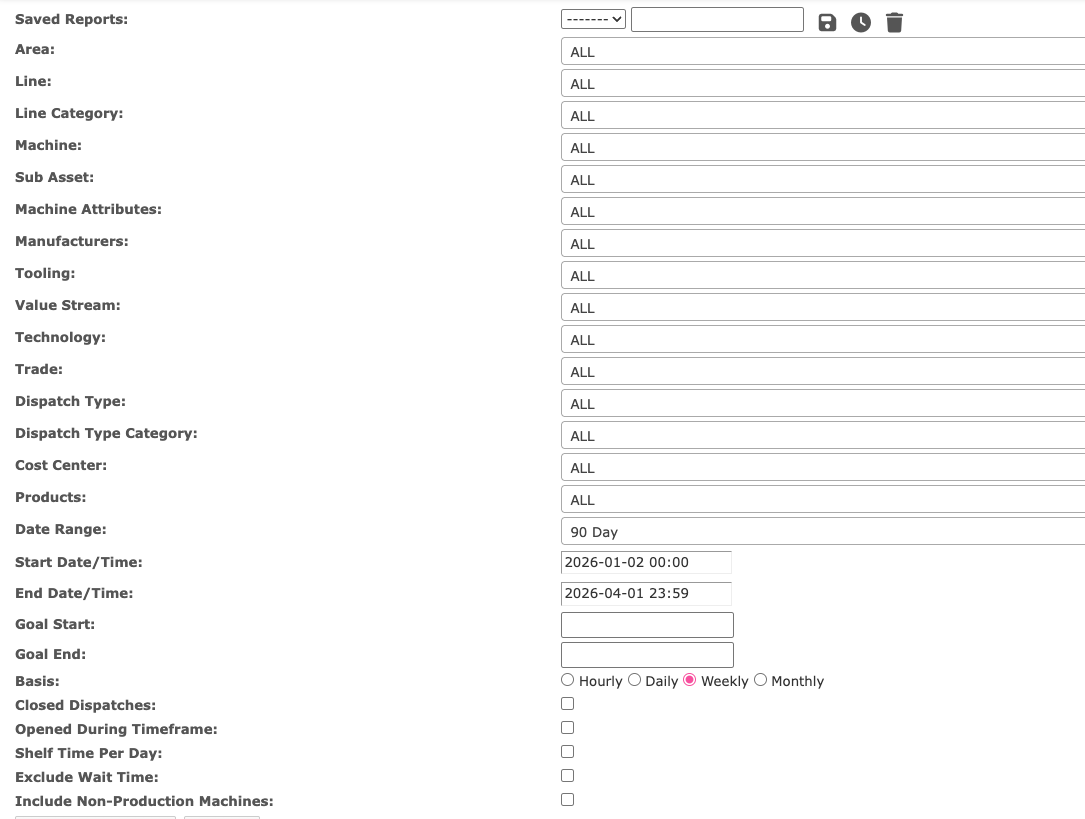
Filters & Parameters:
This view shows the Time Trend report form with the main filters, including location, machine, dispatch, date range, Goal Start, Goal End, and basis options.
Data Visualization
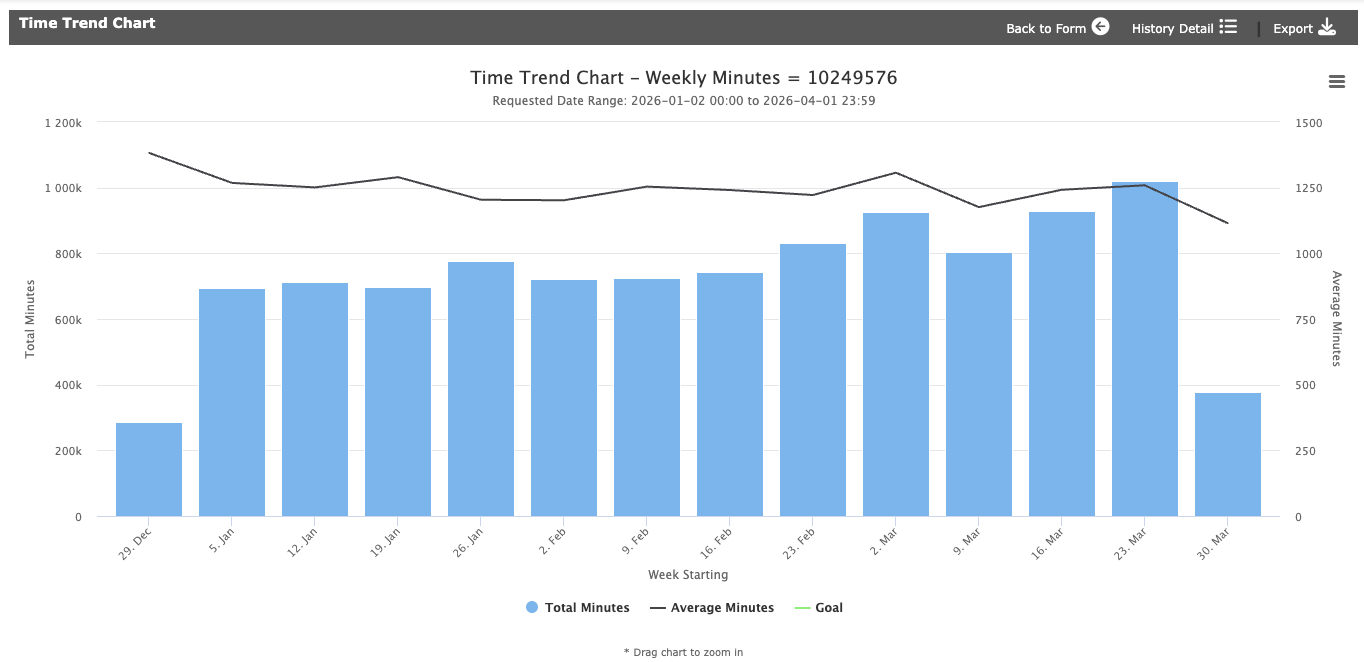
This chart view displays the report results. Blue bars show Total Minutes, and the black line shows Average Minutes across the selected time buckets.
Quick Legend:
After clicking "Display Results," the system generates a multi-layered chart:
Blue Bars: Represent Total Minutes (Aggregate volume).
Black Line: Represents Average Minutes (Duration trend).
Goal Line: A diagonal path connecting your Start and End goals to measure progress.
Analysis of Results
The chart is designed to help you distinguish between "busy-ness" and "efficiency":
Volume vs. Efficiency: By looking at the Average Minutes (black line) independently of the Total Minutes (blue bars), you can see if dispatches are trending longer or shorter, even during high-volume spikes.
Example: On a day with 20,849 total minutes across 103 dispatches, the average is 202 minutes. If the average rises the next day while volume stays the same, it indicates a decrease in efficiency.
Goal Tracking: If the black line stays below your Goal Line, the team is exceeding the planned improvement path.
Other Options
Once the report is generated, you can take the following actions:
Drill Down: Click "History Detail" in the upper-right action bar to see the specific dispatch-level data behind the trend.
Refine Search: Use "Back to Form" to adjust your filters while preserving your current criteria.
Automate: Open the upper-right menu to:
Save as Template: Store your current filters for future use.
Schedule: Set up recurring delivery to your inbox.
Export: Download the data for external presentations.
FAQs and Troubleshooting
Average Minutes is calculated by dividing total dispatch minutes by the number of dispatches in each reporting bucket. This metric helps you compare average event duration across days, weeks, or months, even when dispatch volume changes. For example, if June 23 includes 20,849 total minutes across 103 dispatches, the Average Minutes value is 202. When you need the dispatch count or dispatch-level detail behind the chart, review the Dispatch History Report.