We often get asked how to measure production efficiency. OEE is usually the go-to method since you are measuring Availability, Performance and Quality individually. However, OEE doesn't answer the simple question, "How long was I running?" Or, perhaps more importantly, "How long was I not running? This is what the Lost Production Time report is for. We show you exactly why your production lines were not running. We break it down into four main parts: Non-production minutes, Downtime minutes, Non-Execution Minutes, and Scrap minutes.
Non-Production minutes
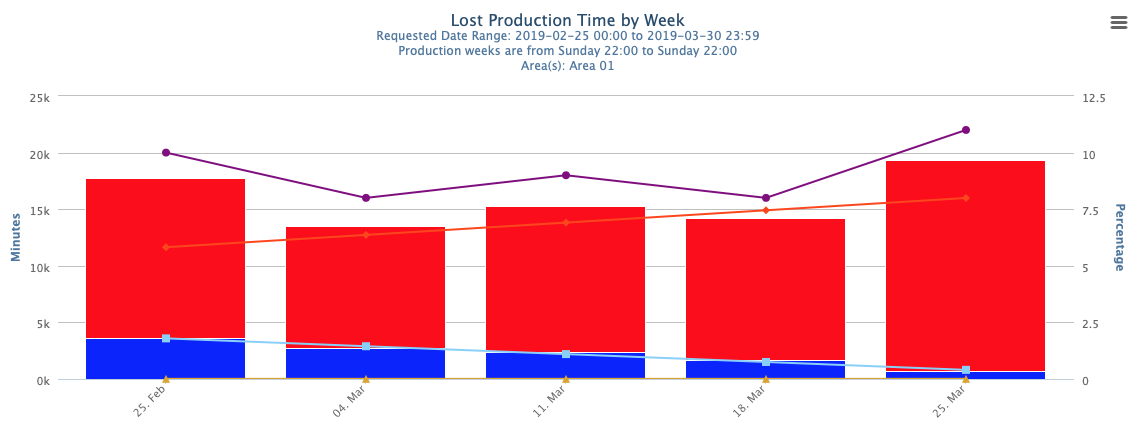
Grey: Non-Production Minutes taken directly from pitch schedules. These are typically startup meetings, stretch time, breaks, lunch, etc.
Downtime Minutes
Red: Non-overlapping downtime minutes for all of the lines in the filter that occurred during the active production pitches scheduled during that time frame. Only Dispatches where the impact is "Down" are considered. This is the same data you see in the downtime column when looking at the individual pitches in the operator portal / pitch boards.
The downtime minutes displayed in this report represents downtime that occurred during active pitches. This shows the effects of downtime on the production schedule. You can click on a downtime bar to drill down to the Time Pareto report which shows the total downtime during that period with no regard to the production schedule. So the Time Pareto report may show more downtime than the lost production report. This will occur when a machine goes down and is fixed after the production shift has ended.
This report also includes a Linear Downtime Minutes line to show the trend of downtime over the duration of the report.
Non-Execution Minutes
Blue: Non-execution time in minutes. The production time that is neither downtime nor time spent making parts. Essentially, this is unaccounted time. Non-execution minutes is calculated for each pitch, and summed for the report. Non-Execution minutes are calculated from Production Pitch data, not from Dispatches. This is how the non-execution time is calculated per pitch:
If demand > 0: ((Demand - Actual) * Cycle Time in Seconds) / 60
If demand = 0: ((((Planned production minutes – Downtime minutes) * 60 / Cycle Time in Seconds) – Actual) * Cycle Time) / 60
This report also includes a Linear Non-Execution Minutes line to show the trend of non-execution over the duration of the report.
Scrap Minutes
Yellow: Scrap time in minutes. The time spent making scrap parts instead of making good parts. Here’s the formula:
Scrap * Cycle Time in Seconds) / 60
This report also includes a Linear Scrap Minutes line to show the trend of scrap minutes over the duration of the report.
Lost Time Ratio
Purple: The percentage of lost time (red + blue + yellow above) against total planned production minutes. Here’s the formula:
((Downtime Minutes + Non Execution Time Minutes + Scrap Minutes) / Planned Production Minutes) * 100