Step By Step Configuration:
1. Initialization of a new Gateway-
-
To open the interface for the gateways and sensorbots navigate to the settings page-> click on gateways -> Then click on Open Accumine Edge.

EDGE:

Here is the view when Edge is opened. To add a new gateway click on the highlighted plus icon.

Fill in the mac address from the device and add a name for the gateway. Then provide this information to customer support for finishing the configuration of the gateway.
2. Configuration of an Asset-
To link a sensorbot to a site we need to first make an asset. Assets are usually names of machines the sensorbot is installed on.

Here is the Edge site asset creation form. Give the asset a name. After all the settings for the asset are configured click submit. The background screen will flash a little but this screen will remain open. The new asset will show up in the list on the left. It is safe to close the screen at this point.
3. Initialization and Configuration of a Sensorbot-
To configure a new sensorbot ensure the device is online and connected to the network. Take note of sensorbots mac address.

Click on the highlighted plus icon to add a sensorbot.

Fill in the sensorbots mac address in the provided fields here. Then click on submit.

Here is a sensorbot that has just been added. Next we need to assign a gateway and asset name to this sensorbot. Click on asset to show a list of assets to choose from. Select the appropriate asset. Next click on gateway and select the correct gateway for the asset. Now in the actions column click on the pen icon to begin calibrating the inputs to the bot.

Here is the inputs screen. Configure the proper inputs for your application as discussed earlier in the article.
4. Sensorbot Data Flow configuration
Data flows are the first logical structure in L2L Machine Connect cloud to receive the binary sensorbot generated machine data, to convert and save it as coherent manufacturing related data to its datalake.

Click on the drop down to find the asset to make a new data flow for.

Click on the empty box to start a new flow. Give the new flow a name and press go.

Flow Start:

Here we are presented with 3 different options.
DIY: This will allow the creation of a flow from scratch.
Copy Existing: This will copy a flow one has already made for this factory id to this new flow.
Start From Template: This will allow you to choose from a list of templates all customers have published.
Available Tools
Inputs
A dataflow require at least one input to function. They are basically the outputs of Sensorbots. All inputs can be assigned to outputs in a one to one relationship but it is always beneficial to utilize a transform logic in dataflows to filter and create a coherent output that can be used by rules engine.
Outputs
A dataflow require at least one output so it generates a useable data to be used in the Rule engine.
Transforms
Transform utilization is not a requirement but highly recommended for creating coherent and meaningful data. L2L provides a lot of templates to be used as reference for different dataflow usecases (ex. uptime, downtime, count, alarm, state etc). Transforms also support JS for logic and data manipulation.
Sensorbot specific inputs:

On the left is the inputs, transforms, and outputs for a flow. Shown is a list of available inputs from the sensorbot we have chosen.
All sensorbots on a site inputs:

Shown is a list of all sensorbots inputs on the site.
Transforms:

Shown is the start of the list of transforms available for a flow. When using functions that have multiple inputs such as an AND the data will buffer on one input when there is nothing to process on the other input. Make sure all inputs to a function like this have the same rates of data so there are no buffering issues. All these functions have descriptions on how they work. Just click and drag any to the workspace and then click on the function again to get the description on the right side of the screen.

example of a function in the workspace and its description.
Outputs:

Shown are the two outputs for a function. The accumine database function will pass data into a table in Connect. The Send Alert will send email alerts.
Example Usecase:
This example will go through setting up a downtime/in-cycle flow for the amp1 input for this bot.
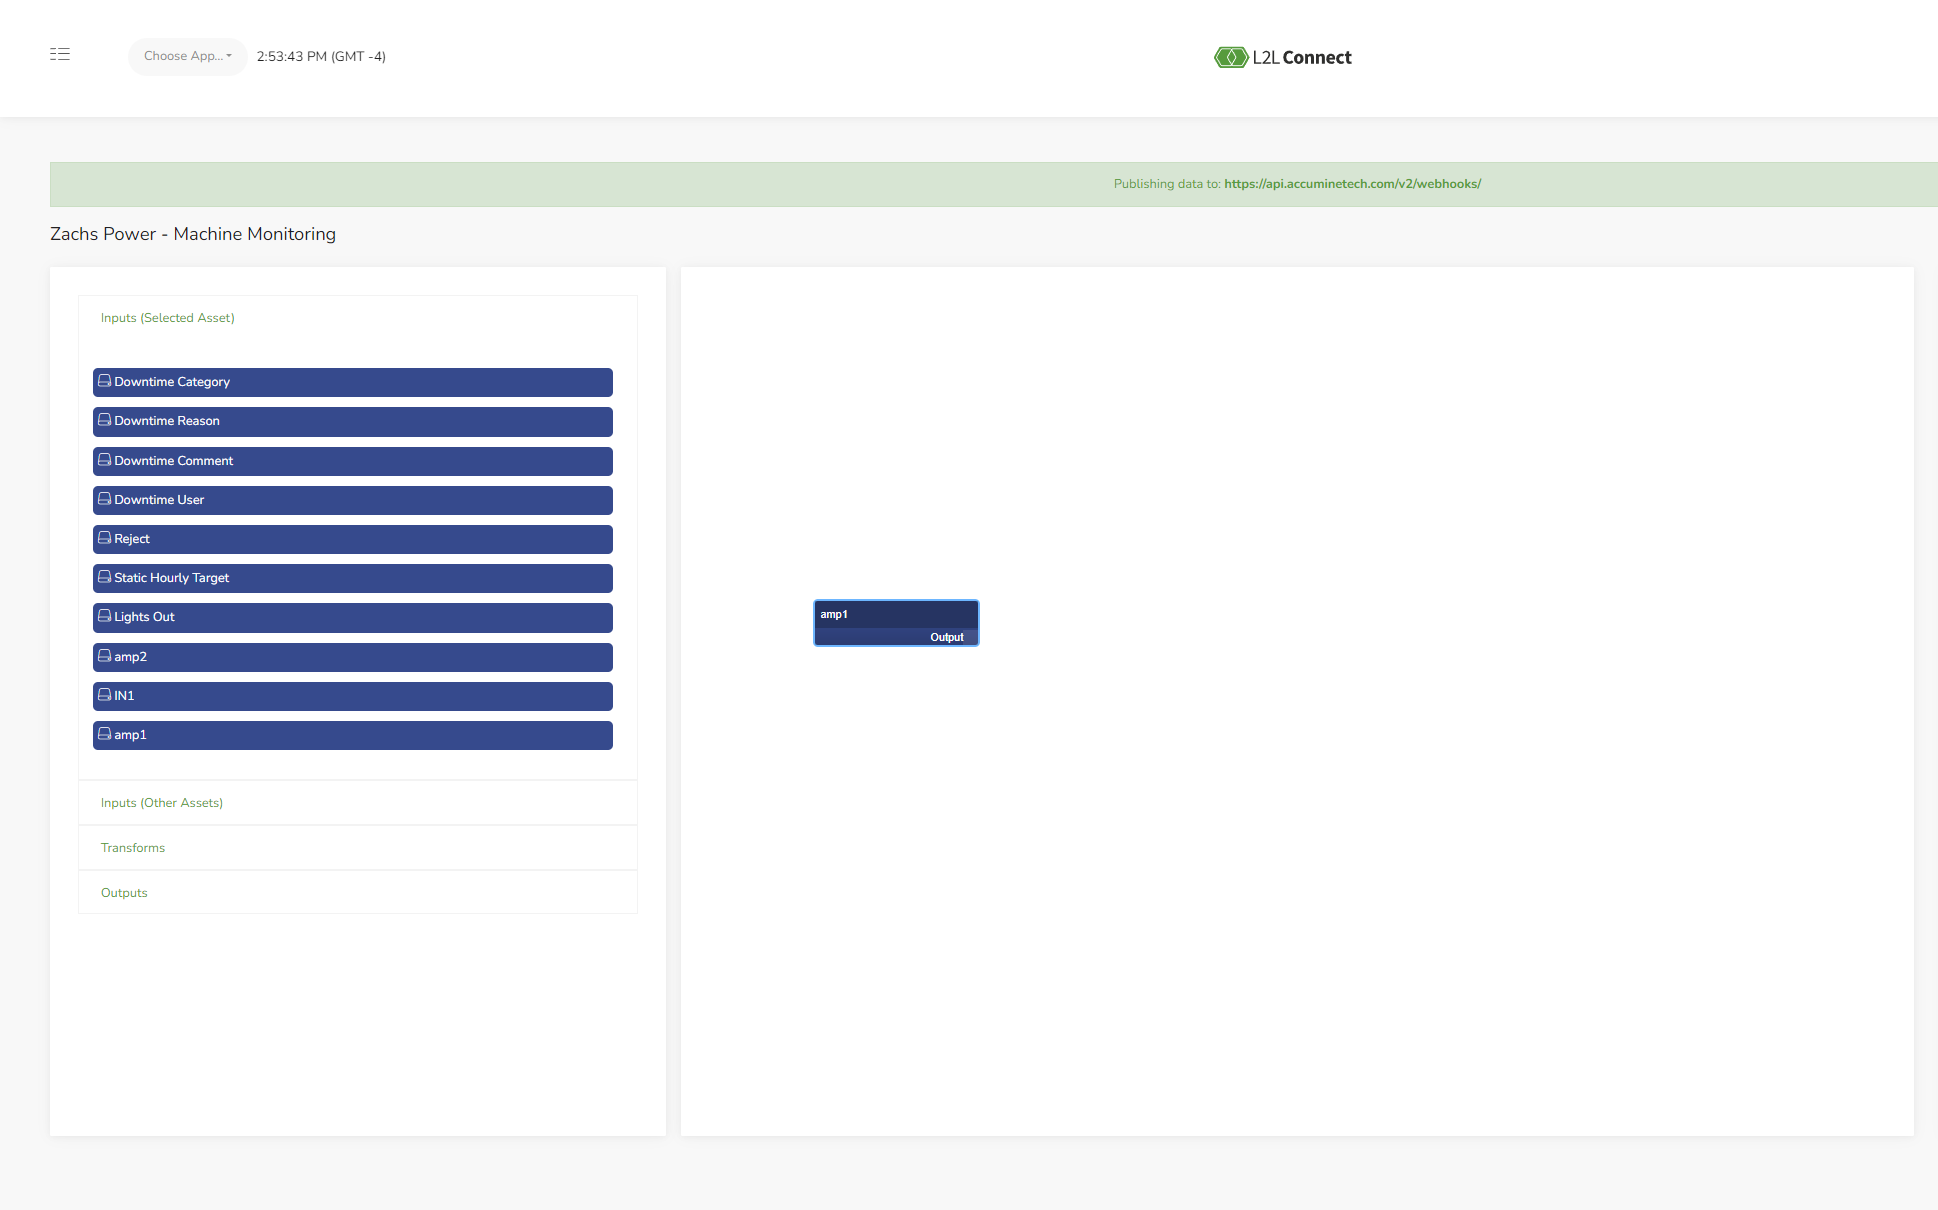
Shown here is the amp1 input dragged from the list on the left to the working space in the middle. This input is calibrated as a periodic measurement. Therefore the data is represented as a decimal value that represents the current value present at the input.

Here we have a map function. In this rule we wish to convert the value coming from the bot to a true or false based on a threshold in the code we paste in the map function. The value 1000 is the threshold we wish to set. Any value from the bot above the threshold will be converted to a true value for the rest of the flow. Any value from the bot below the threshold will be converted to a false value.
function(obj) {
if (obj.value > 1000) {
obj.value = true;
} else {
obj.value = false;
}
return obj;
}

Next this we need is a timeout function. If we don't get a true value in the set timeout time then we output a true value from the timeout. Here we have set the time out to 30000ms or 30 seconds.

Next we will filter duplicate values. We only need 1 consecutive true or false value to trigger the in-cycle or downtime events so we filter out any following trues or falses after the first one.

Now we can grab our outputs for the flow and a NOT function. The output connected to the filter duplicate values will be pointed to the Downtime table. The output connected to the NOT function will be pointed to the In-Cycle table.
5. Part Count - Rule Creation-
This example rule will go over sending part counts over to the production module for a single sensorbot.

Firstly, if we wish to make a rule for one specific asset we need to copy the deviceid of the asset to set up the filter later. Here we are going to use Zachs power for the rule.

We are going to use a record trigger for this example. Click and drag the function to the workspace on the right.

When we let go of the function in the workspace this form will pop up. Here we have set the data model to be Classic/Part Count. This is now reading from that table. We have selected the created modifier so the rule will be triggered every time the Classic/Part Count table gets a new event added to it. The listen for API/Pre-Processor box needs to be ticked on to make sure the rule functions when a sensorbot sends in a packet.

After that we click on the Add record conditions to add a filter to the function. Pictured above is the start of adding a filter to the downtime records table. Click on deviceid.

This is where we will paste the deviceid we copied earlier. This will only look for records in this table that match the deviceid of the asset. click on update filter.
 If we click on the blue button that says 1 filter it will show what the filter is set to. Otherwise we can just click the X in the top right corner of the box to dismiss the filters box. Back on the records trigger form we can click on submit now.

Very simply all we need to do is drag a SendFormData function to the workspace and connect the two functions together by clicking on the little dot on the right of the record trigger function and dragging it to the left dot on the SendFormData function to connect the two. This connection needs to happen before we edit the SendFormData function to make the variables in the record trigger available for the SendFormData to use. Double click on the SendFormData.

This is where we set up the API call for the rule. In this example we will be using the dispatches/open method for opening a new dispatch. "https://<company>.leading2lean.com/api/1.0/pitchdetails/record_details/?auth=<API_key>". Refer to API documentation for the necessary and optional fields for this call.


Shown is a nearly complete form. We would change the <company> to your company and change <API_Key> to the api key we wish to use. These are the least amount of fields required to open a dispatch. When functions are connected we can reference the data gathered a function later in another function by using ":V" to get a list of data available. For the field "Actual" we need to get the part count value for the event that triggered the rule.

This is an example of the variables available to use in this rule. RecordTrigger is the function that is getting the part count data. Click on RecordTrigger.value to add this variable to the rule.

The dates need to be formatted into the API acceptable format. To start we need a date_format. In the list find this function. Then we need an open parenthesis "(" then a space then we can add a recordtrigger.timestart variable. then we can add the format and an optional time zone with "yyyy-MM-dd HH:mm:ss".
Since the endtime of a part count event doesn't get populated until the next part comes in from the bot there wont be a time end for the record that triggers the rule so we use the time start again but add 10 or so seconds to the timestamp.

Pictured here is our complete rule. First we can tick the enable inputs and enable outputs in the top right. Now in the top right of the screen click the green save button.

Here we can give the rule a name and description.
Save: This will save the rule and go back to the workspace.
Save & Start Debugger: This will save the rule and navigate to a screen useful for watching the rule run and troubleshooting.
Save & Exit Builder: This will save the rule and navigate back to the list of rules for the site.
Here we will click on the Save & Exit Builder to return to the list of rules.
6. Open Dispatch - Rule Creation.
Now we will go through the process of making a rule for launching a dispatch based on a downtime event start for one specific asset.

Firstly, if we wish to make a rule for one specific asset we need to copy the deviceid of the asset to set up the filter later. Here we are going to use Zachs power for the rule.

We are going to use a record trigger for this example. Click and drag the function to the workspace on the right.

When we let go of the function in the workspace this form will pop up. Here we have set the data model to be Classic/Downtime. This is now reading from that table. We have selected the created modifier so the rule will be triggered every time the Classic/Downtime table gets a new event added to it. The listen for API/Pre-Processor box needs to be ticked on to make sure the rule functions when a sensorbot is the source of the new downtime event in the table.

After that we click on the Add record conditions to add a filter to the function. Pictured above is the start of adding a filter to the downtime records table. Click on deviceid.

This is where we will paste the deviceid we copied earlier. This will only look for records in this table that match the deviceid of the asset. click on update filter.

If we click on the blue button that says 1 filter it will show what the filter is set to. Otherwise we can just click the X in the top right corner of the box to dismiss the filters box. Back on the records trigger form we can click on submit now.

Very simply all we need to do is drag a SendFormData function to the workspace and connect the two functions together by clicking on the little dot on the right of the record trigger function and dragging it to the left dot on the SendFormData function to connect the two. This connection needs to happen before we edit the SendFormData function to make the variables in the record trigger available for the SendFormData to use. Double click on the SendFormData.

This is where we set up the API call for the rule. In this example we will be using the dispatches/open method for opening a new dispatch. "https://<company>.leading2lean.com/api/1.0/dispatches/open/?auth=<API_key>". Refer to documentation for the necessary and optional fields for this call.


Shown is a nearly complete form. We would change the <company> to your company and change <API_Key> to the api key we wish to use. These are the least amount of fields required to open a dispatch. Click submit.
 Pictured here is our complete rule. First we can tick the enable inputs and enable outputs in the top right. Now in the top right of the screen click the green save button.

Here we can give the rule a name and description.
Save: This will save the rule and go back to the workspace.
Save & Start Debugger: This will save the rule and navigate to a screen useful for watching the rule run and troubleshooting.
Save & Exit Builder: This will save the rule and navigate back to the list of rules for the site.
Here we will click on the Save & Exit Builder to return to the list of rules.
Now that you have reviewed Machine Connect - Step-by-Step Configuration guide, please continue to learn more about Machine Connect - Reports.