Overview
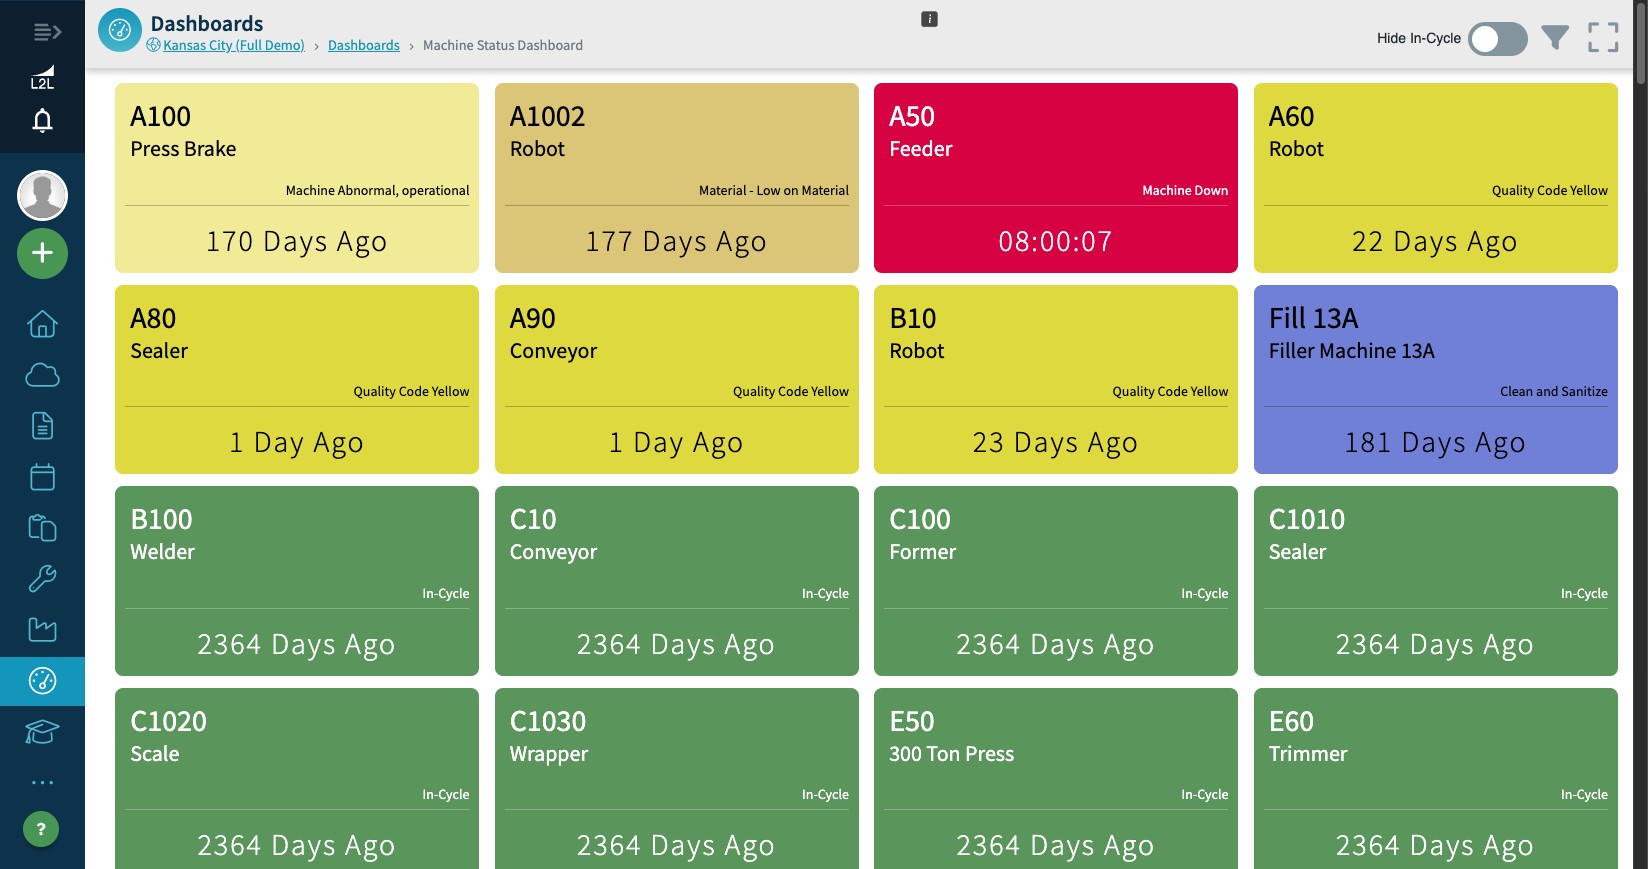
The primary purpose of this dashboard is to be shown on an overhead display so anyone at a site can tell at a glance whether machines are running. The dashboard displays a grid of machine tiles that show each machine name, its current status, and how long it has been in that status. The status comes from a query for open dispatches against that machine, and the tile color comes from the color associated with that dispatch type.
Features
Drag and drop rearrangement - You can move the cards around to display them how you'd like.
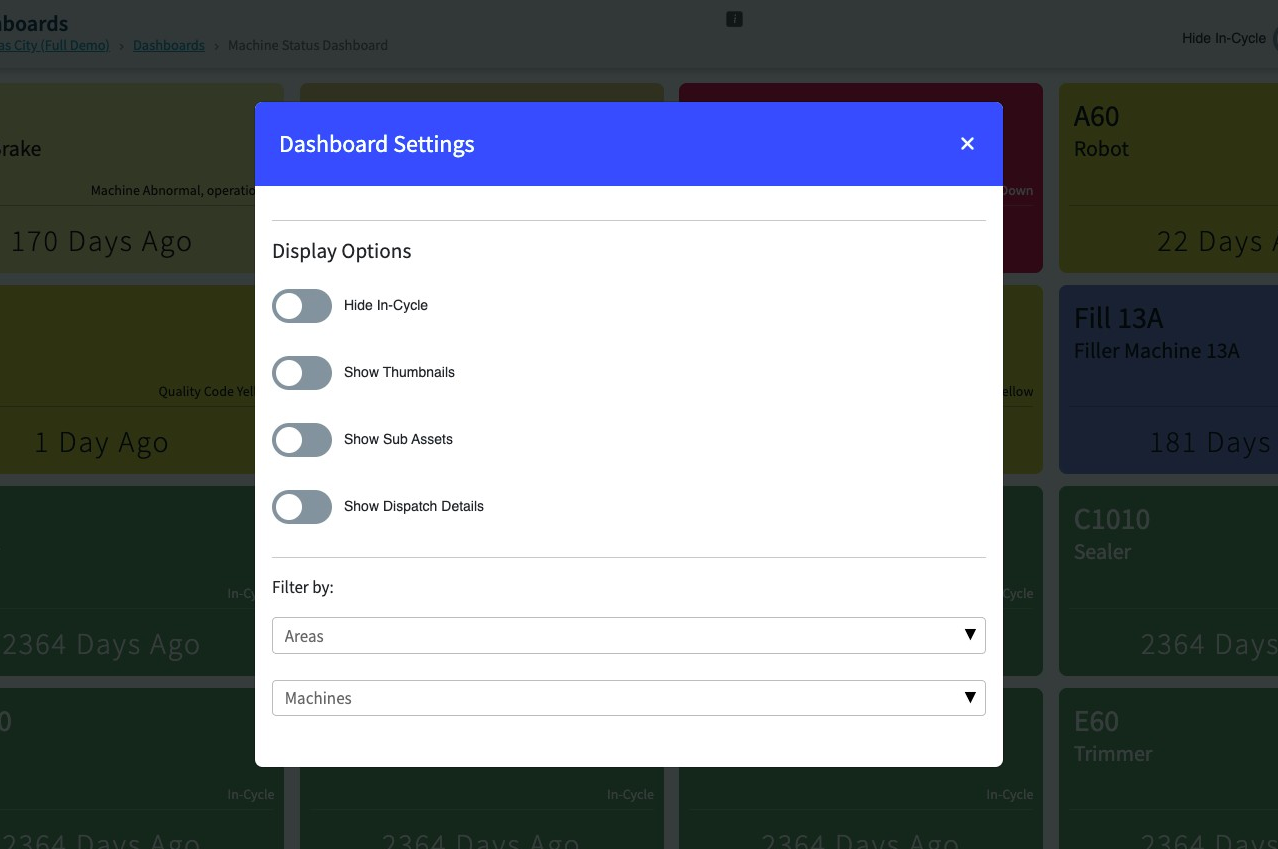
Area and machine filtering - Use the filter icon in the header to open the Dashboard Settings modal, where you can filter the dashboard by Area and Machine. These filters persist if you leave the page and come back.
In Cycle Toggle - This feature will remove the machines that are currently running from the view. To enable this feature and benefit from it, you need to turn it on manually by sliding the bar. There is also a toggle to hide the in cycle.
Show Thumbnails Toggle - This feature when enabled will show the machine image in the upper right corner. To enable this feature and benefit from it, you need to turn it on manually by sliding the bar.
Show Sub Assets Toggle - Will add a tile to the page with the Sub Assets.
Show Dispatch Details Toggle -
- Displays the current dispatch status ("Waiting," "Work in Progress," "Running," or custom status) for each machine or line
- The dashboard updates the dispatch status in near real-time (e.g., updates every 30 seconds or less)
- When a dispatch status is "Work in Progress," the name and icon of the assigned resource is displayed
- If available, the image of the assigned resource is displayed alongside their name and icon
PLEASE NOTE: The dashboard only displays 'impacting' dispatches.