L2L Analytics: Creating a Chart
Last updated: October 14, 2026
Charts are the building blocks of L2L Analytics dashboards. Each chart turns a set of L2L data into a visual you can use to spot trends, compare performance, and track your KPIs. This article explains the two ways to start a new chart: from a saved dataset, or from a SQL query.
Overview
You can begin a chart from either of these starting points:
A saved dataset. Best when the data you need has already been set up as a dataset.
A SQL Lab query. Best for ad-hoc exploration, or when you need to define custom metrics that are not in an existing dataset.
Both methods end in the same place, the Chart Builder page, where you configure how the chart looks and what it shows.
Prerequisites & Preparation
Required Permissions: Your L2L Analytics role determines which method you can use. Creating a chart from a saved dataset requires the Limited Creator role or higher. Creating a chart from a SQL query requires the Primary Creator role or higher.
Dependency: To use the dataset method, the dataset you want to chart must already exist. To use the SQL method, you need access to the data source you want to query.
If you are not sure which role you have, or need it changed, see How to update Roles in L2L Analytics.
Step-by-Step Configuration
Method 1: Create a chart from a dataset
Navigate to the Menu: In the top navigation bar, click the plus icon (+).
Start a Chart: From the dropdown menu, select Chart. The Create a new chart screen opens.
.png)
Choose a Dataset: In the Choose a Dataset field, click the dropdown arrow and select your dataset.
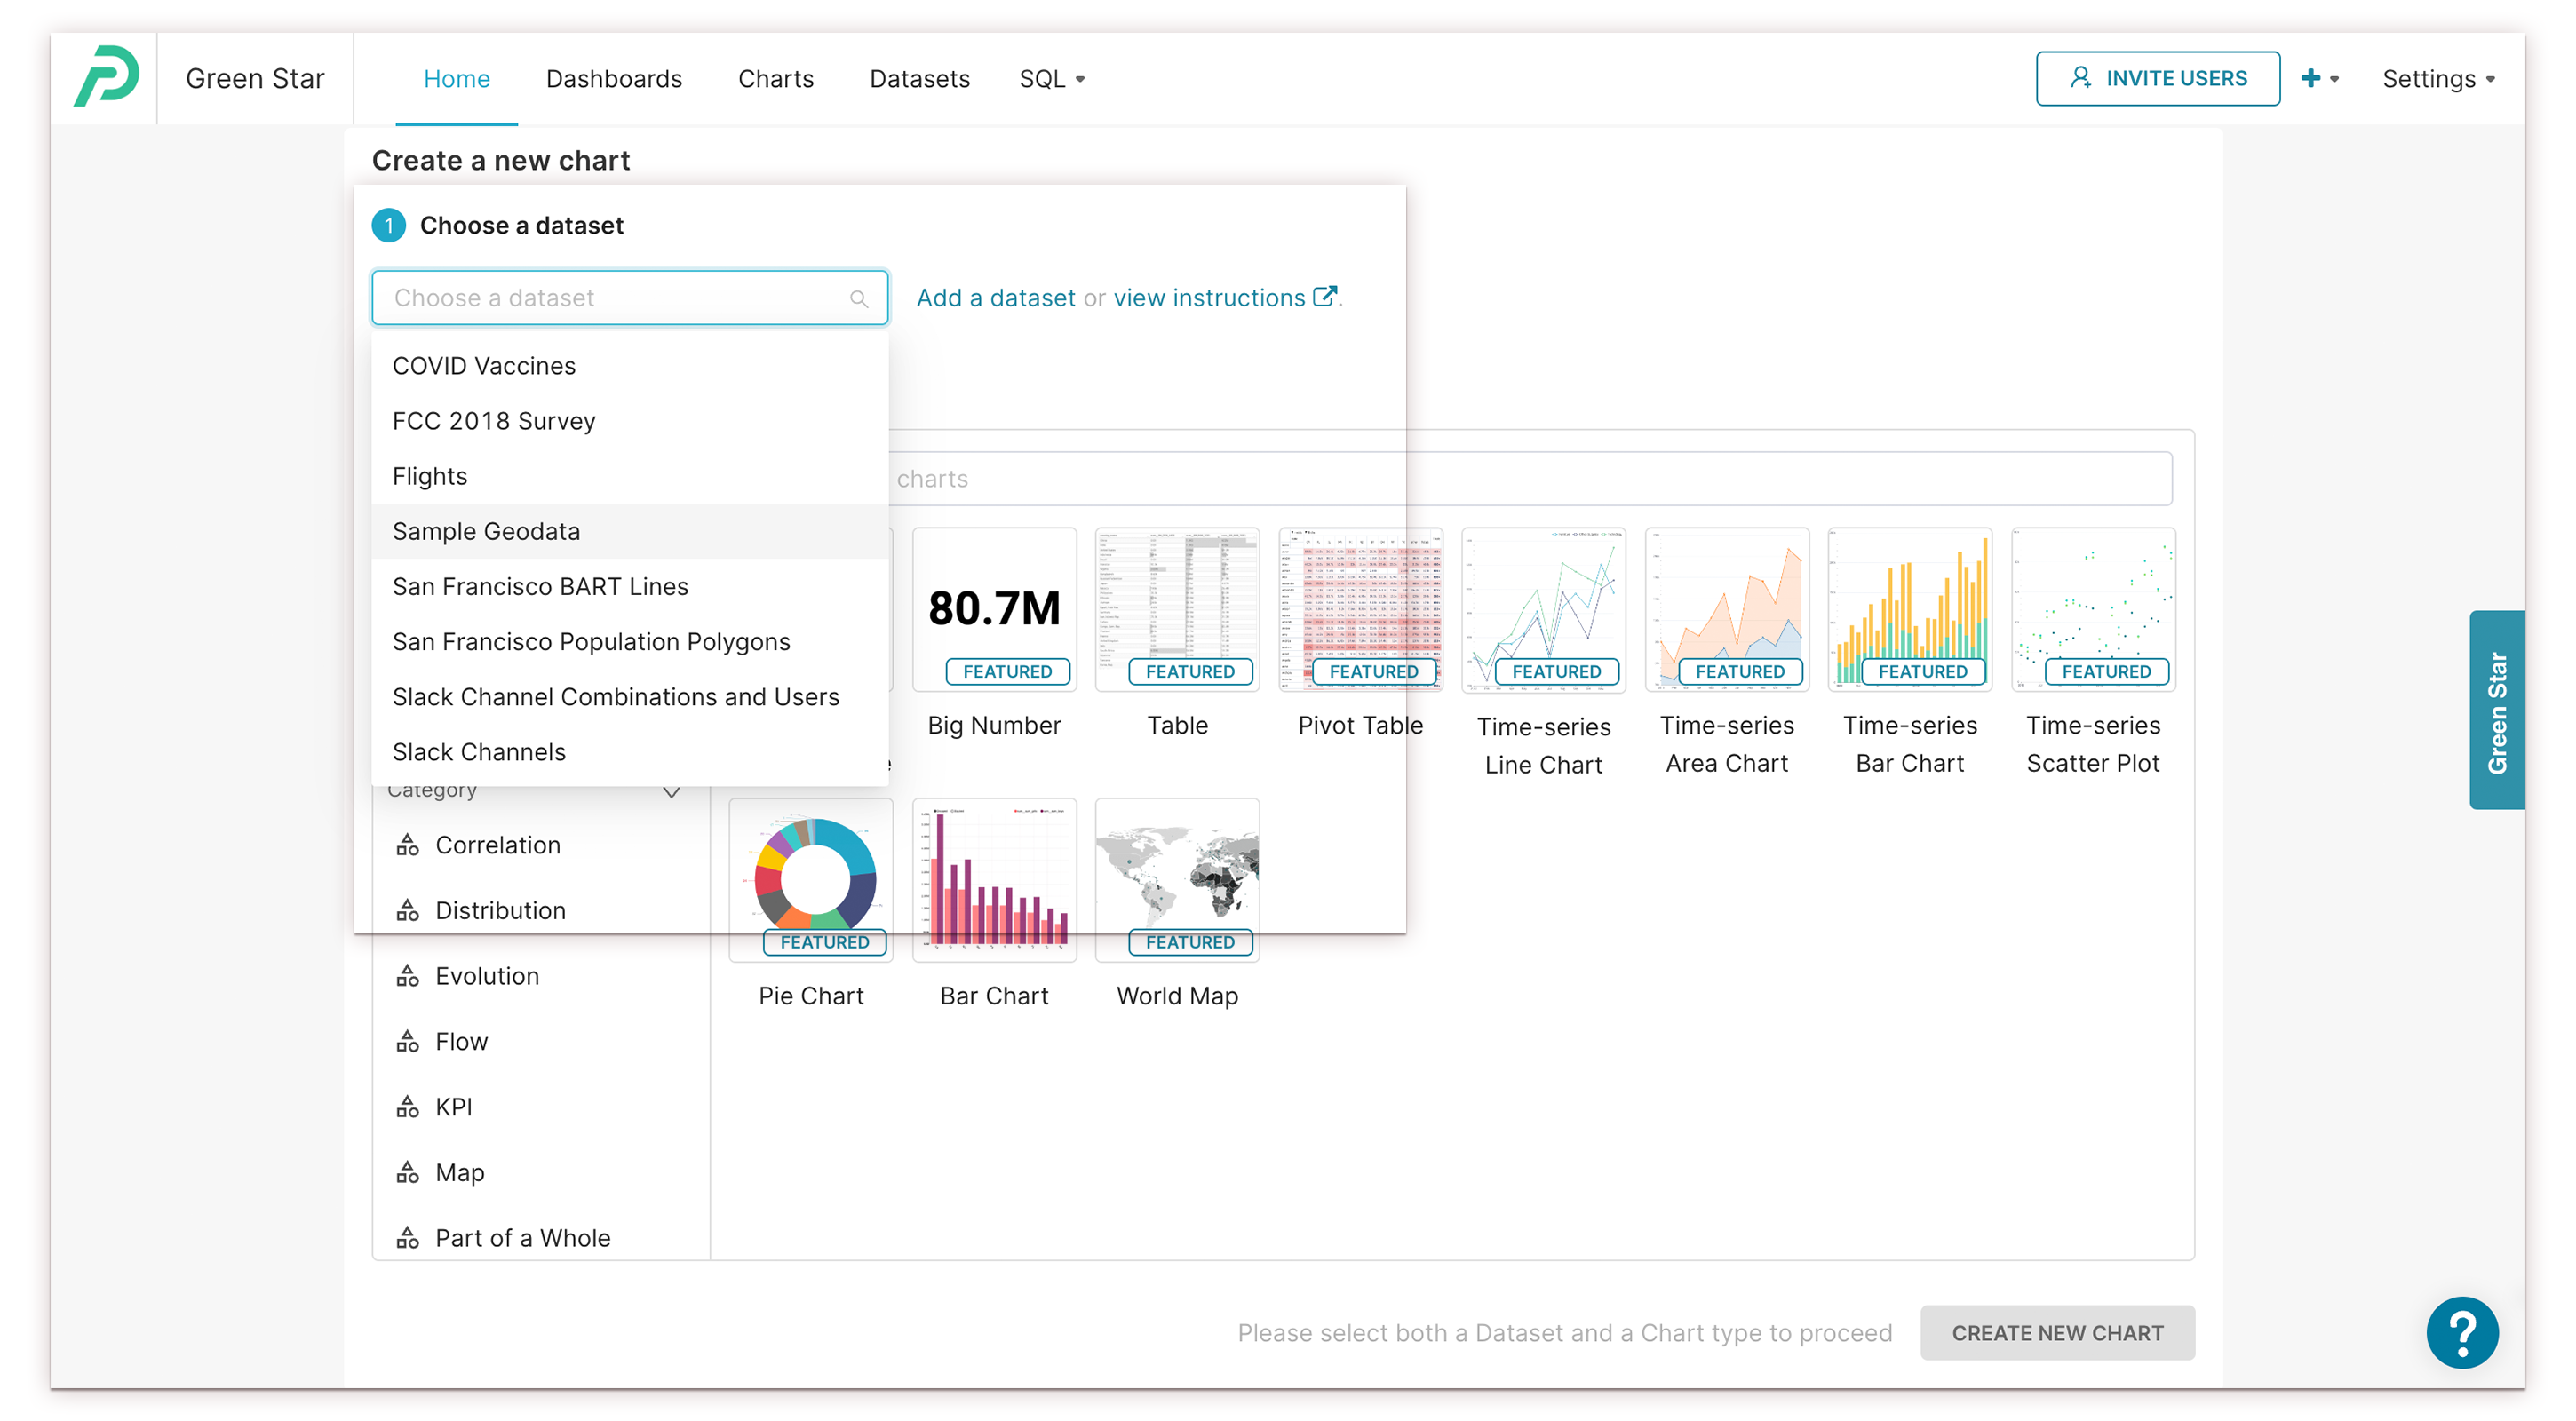
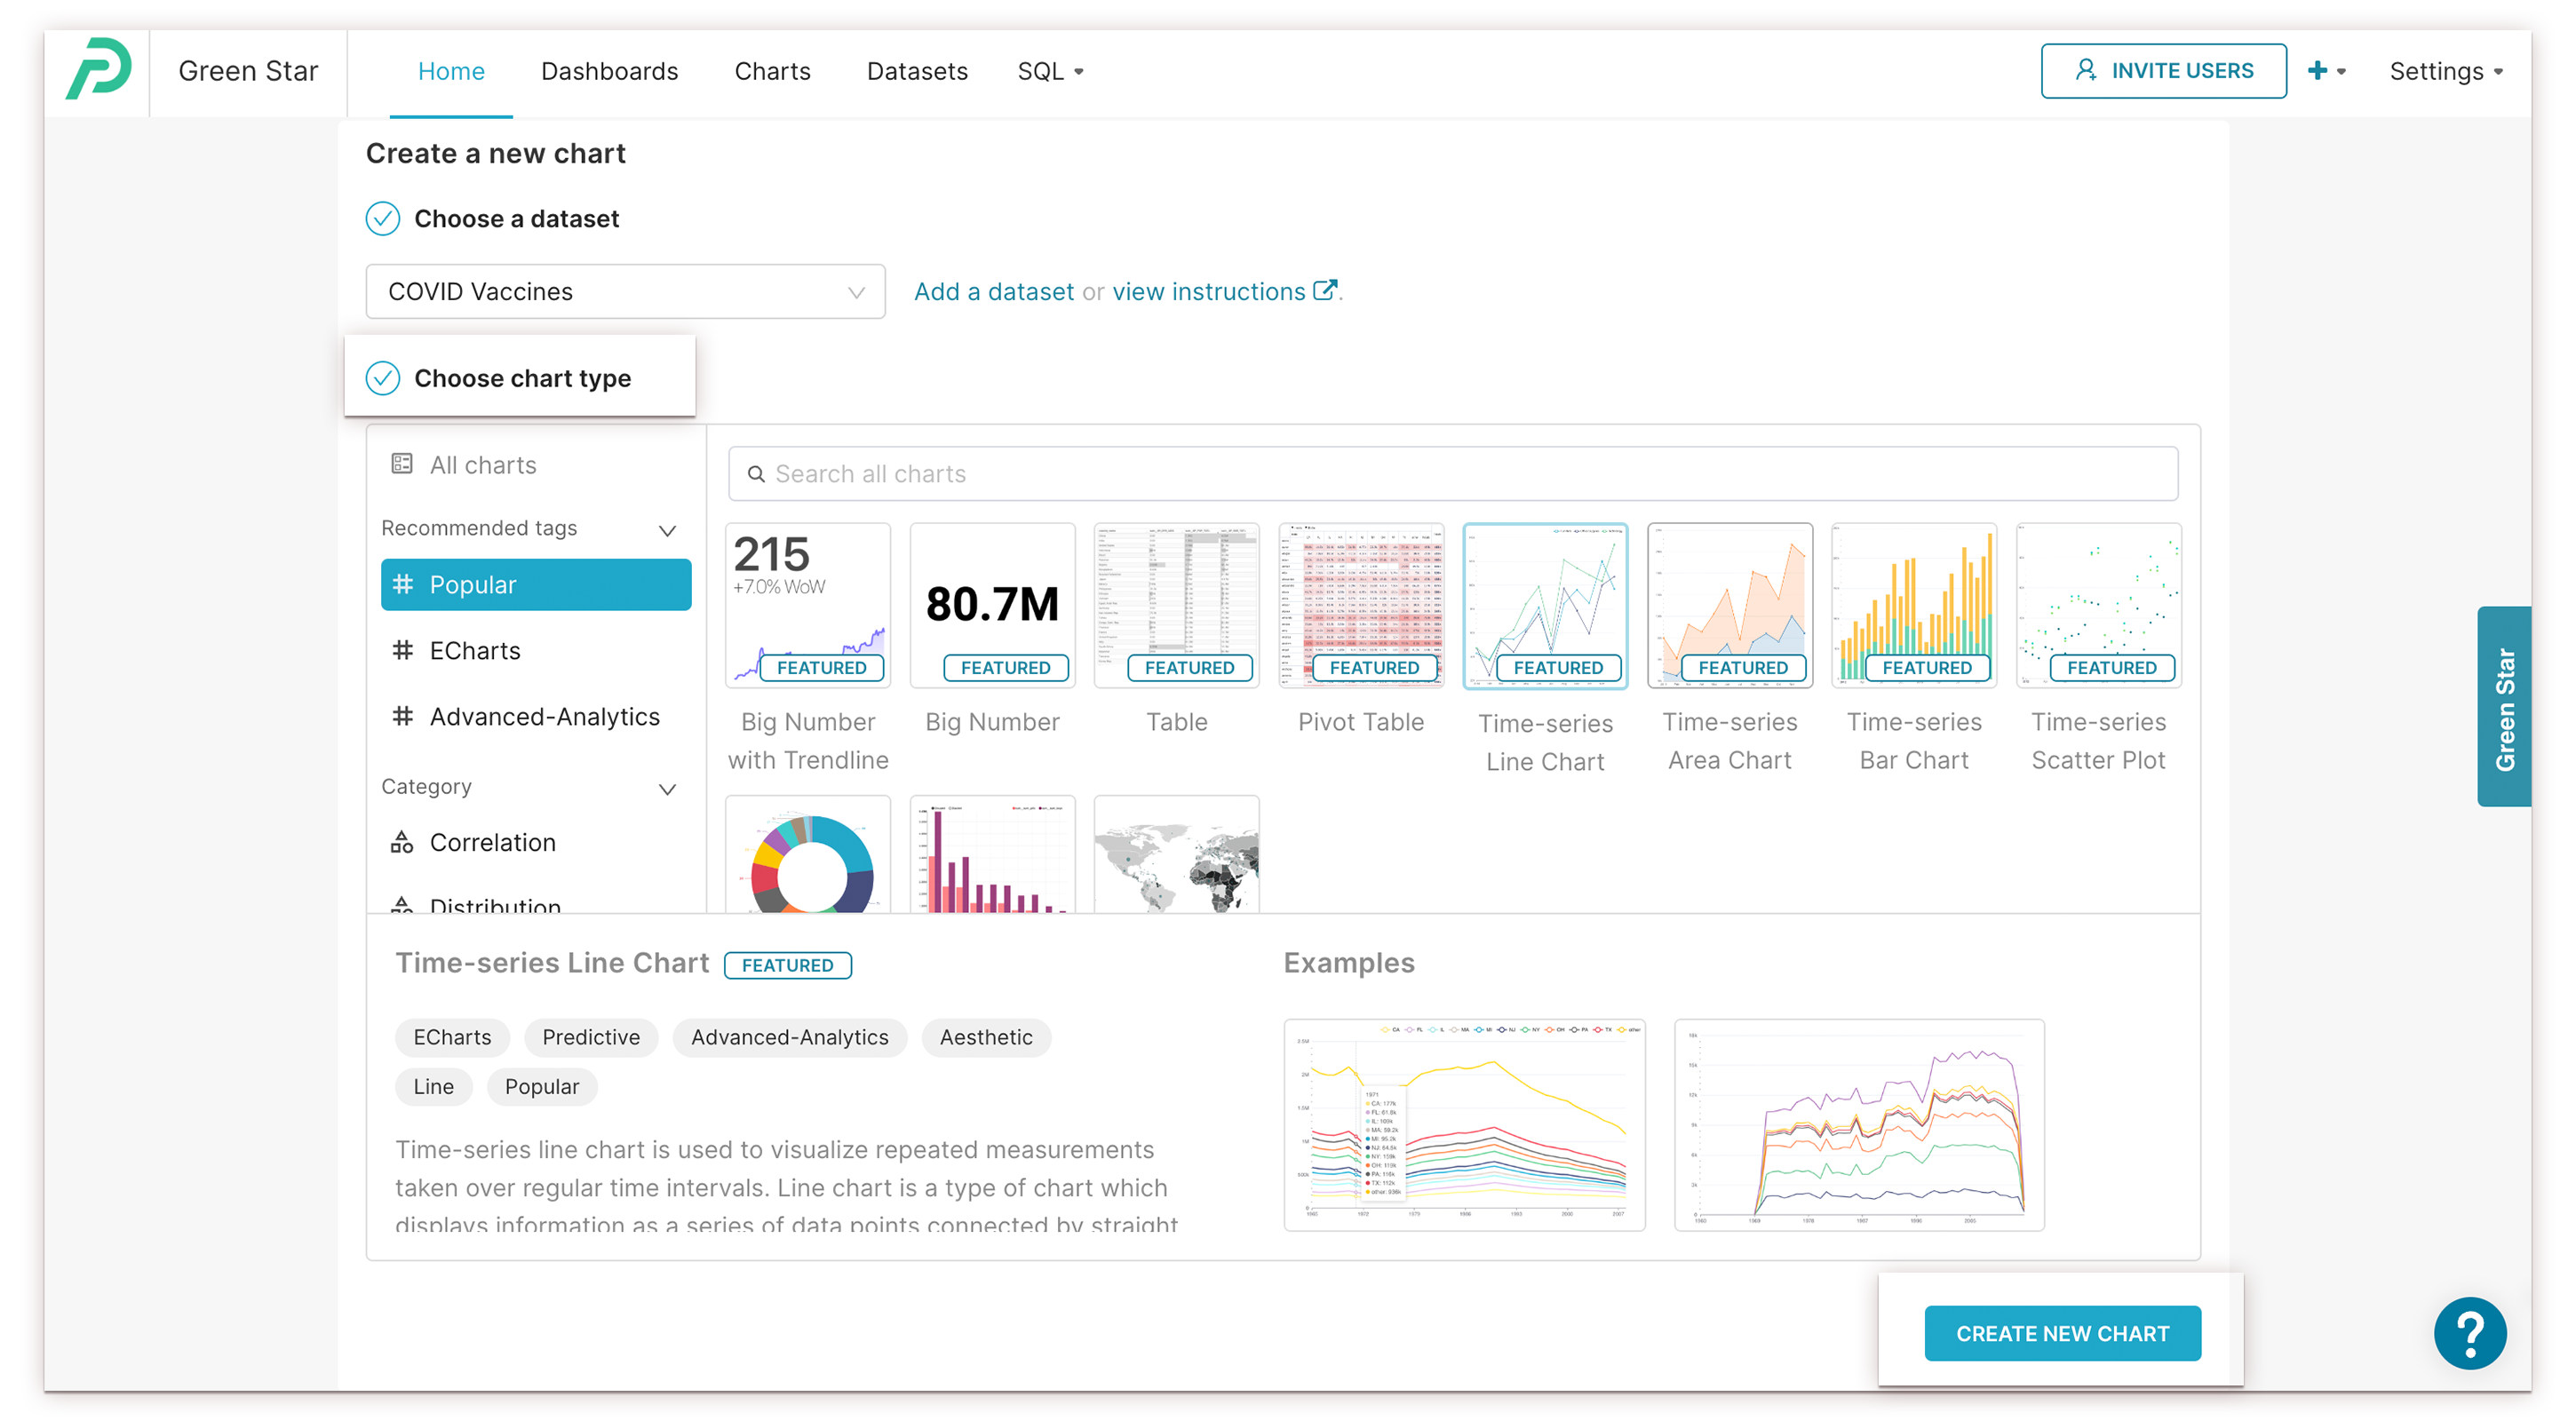
Choose a Chart Type: Select a chart type from the gallery. Chart types marked FEATURED are the recommended place to start.
Create the Chart: Click Create new chart. The Chart Builder page opens.
Configure the Chart: Drag entries from the Metrics and Columns panel into the Configuration panel next to it.
Note: You can change the chart type later from the Data tab, so you do not need to get it right the first time.
Method 2: Create a chart from a SQL query
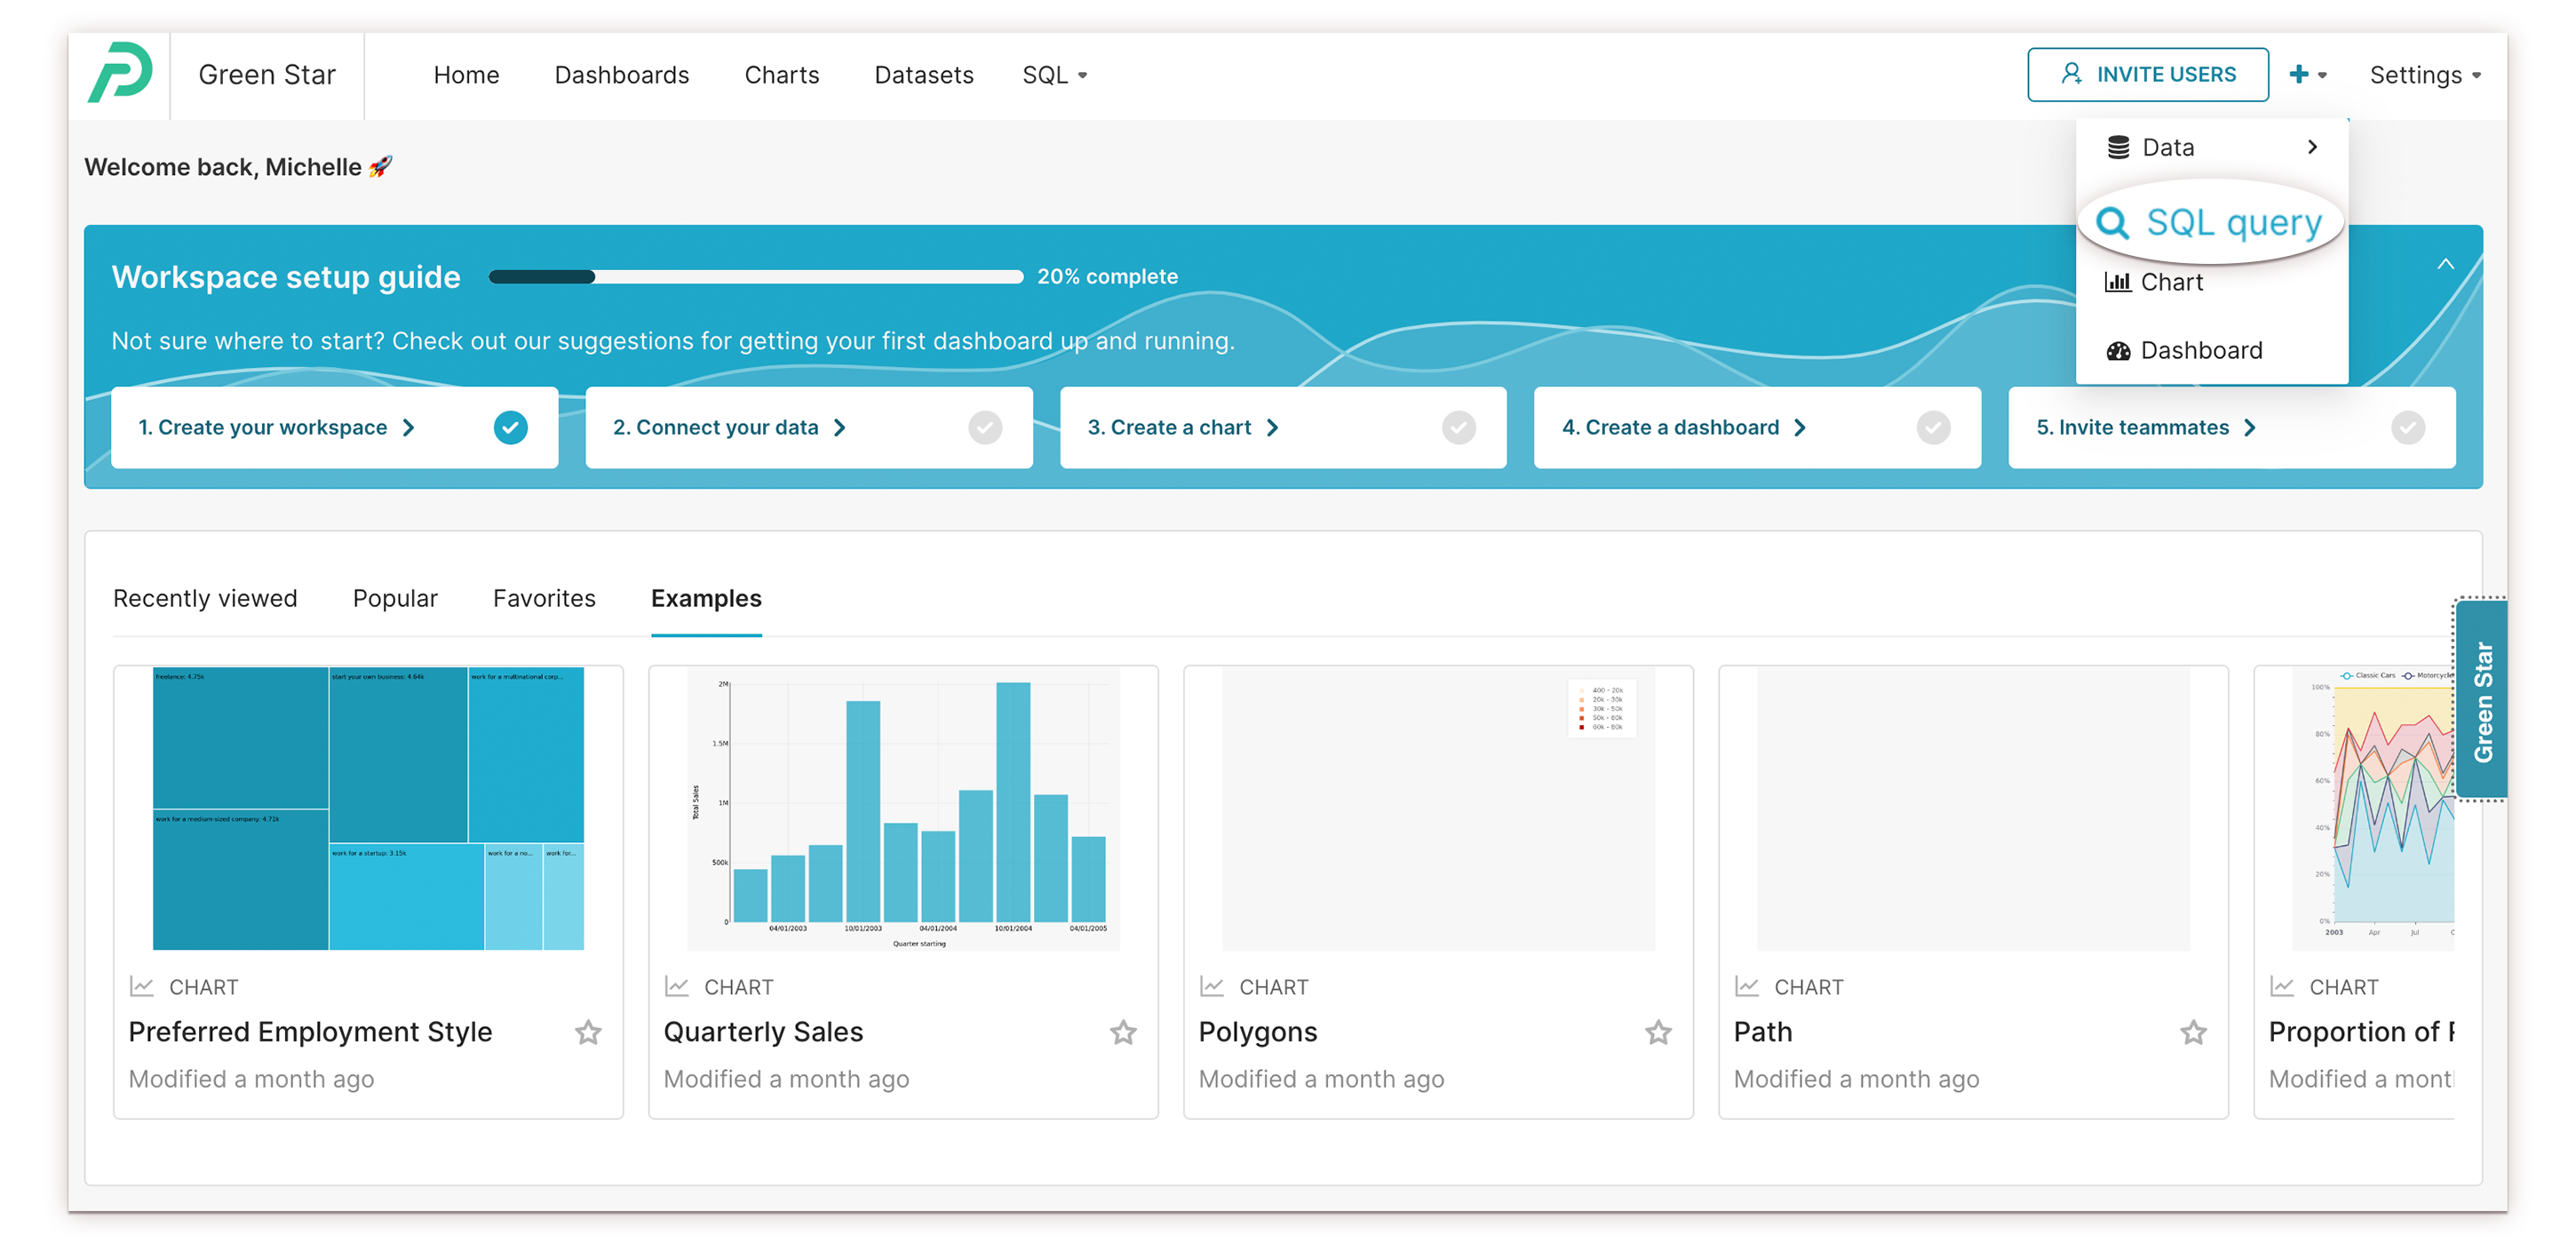
Navigate to the Menu: Hover over the plus icon (+) in the top right corner.
Open SQL Lab: From the dropdown menu, select SQL Query.
Select a Data Source: Choose the data source you want to query from the left-hand panel.
Enter Your Query: Type your SQL query into the text box.
Run the Query: Click Run. The Create Chart button appears once the query runs.
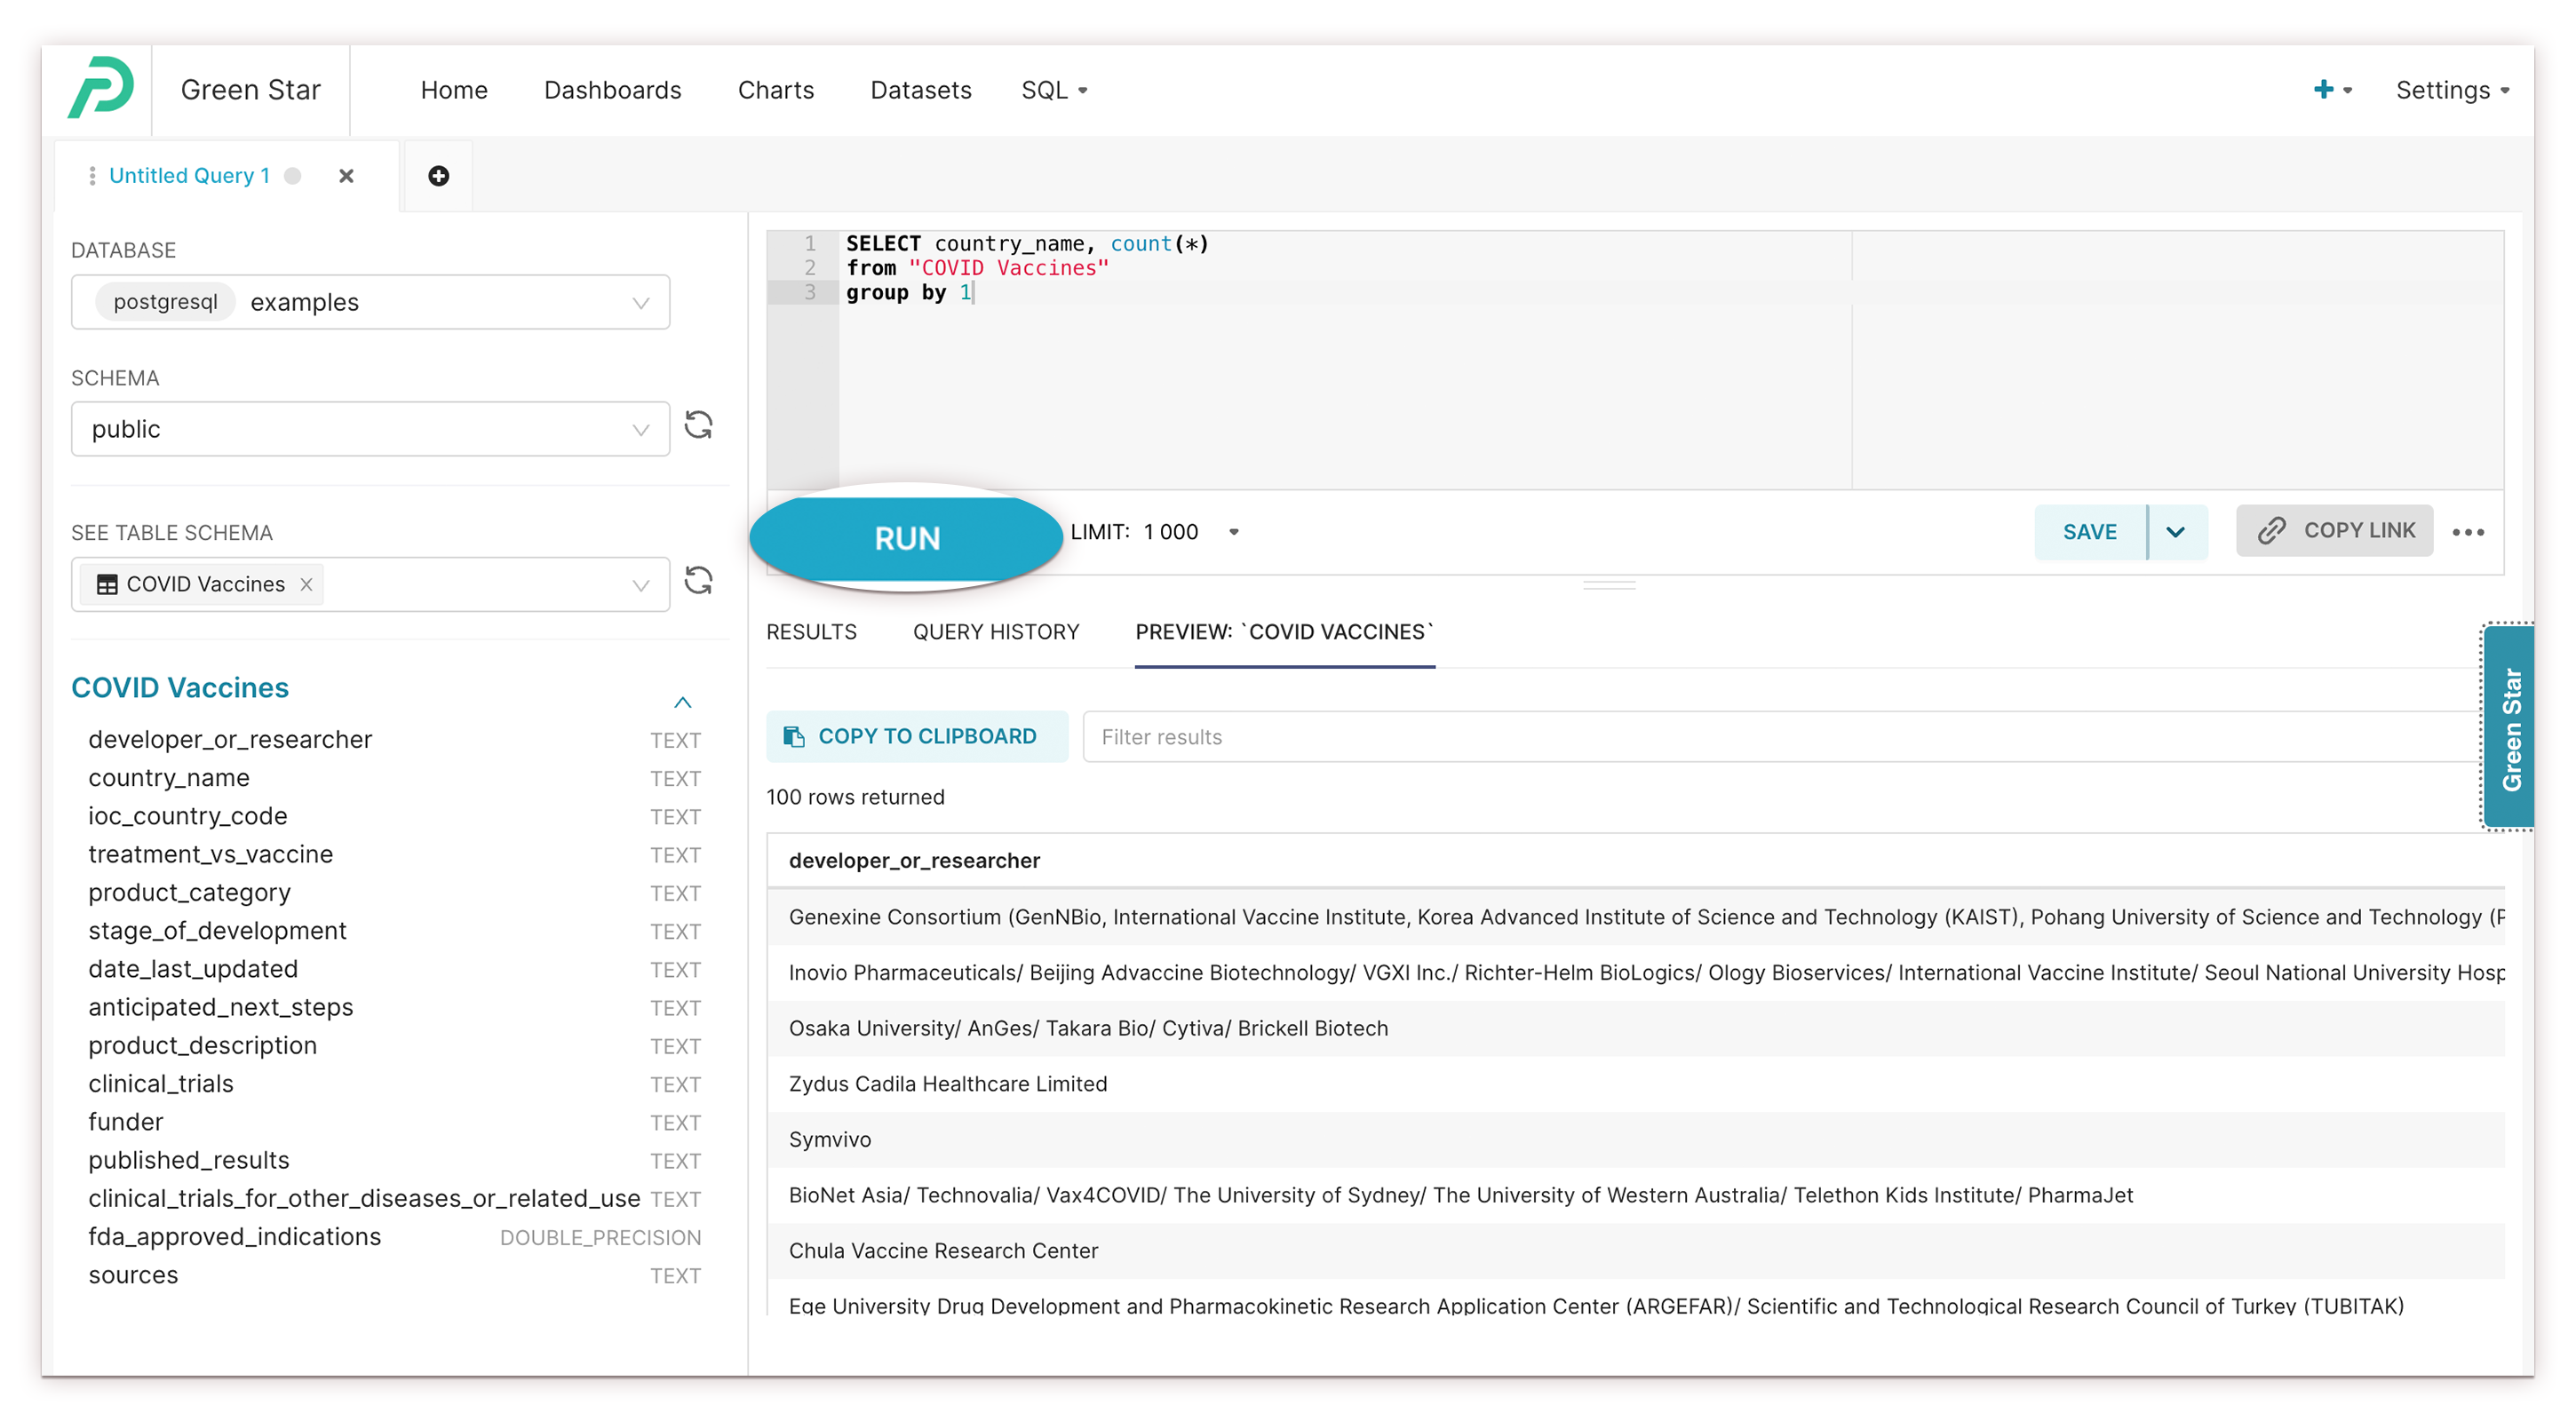
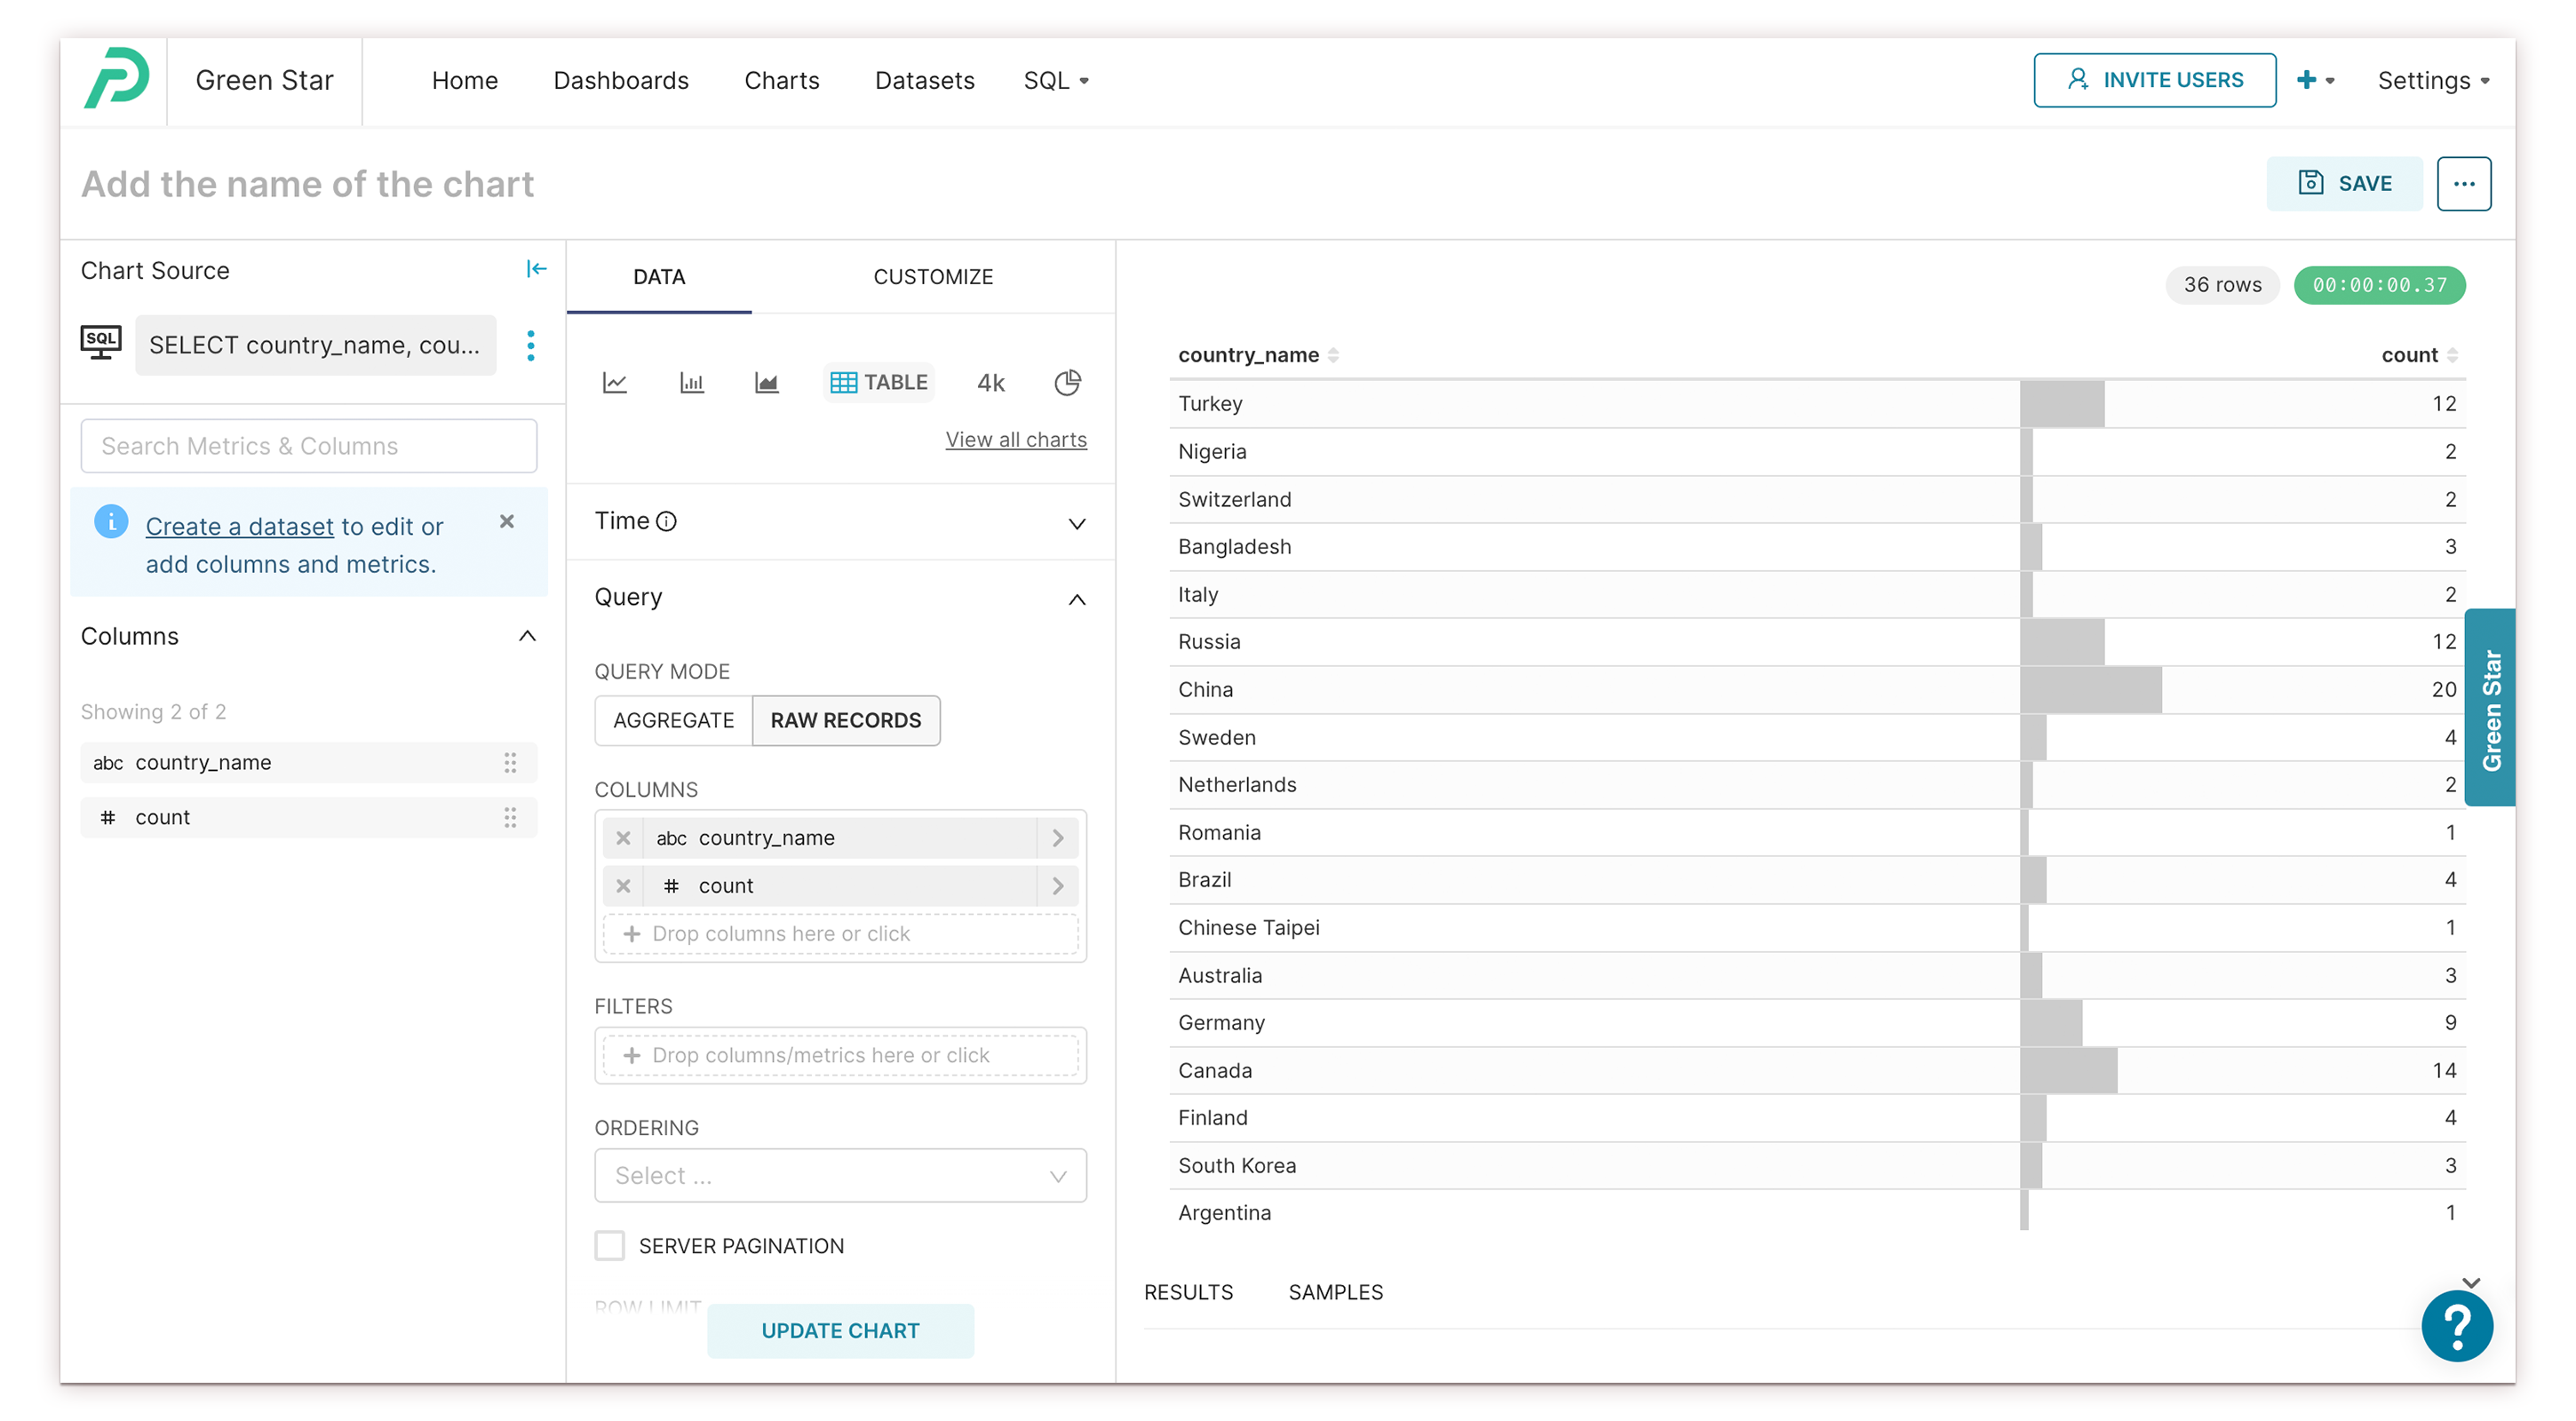
Create the Chart: After the query completes successfully, click Create Chart. The Chart Builder page opens.
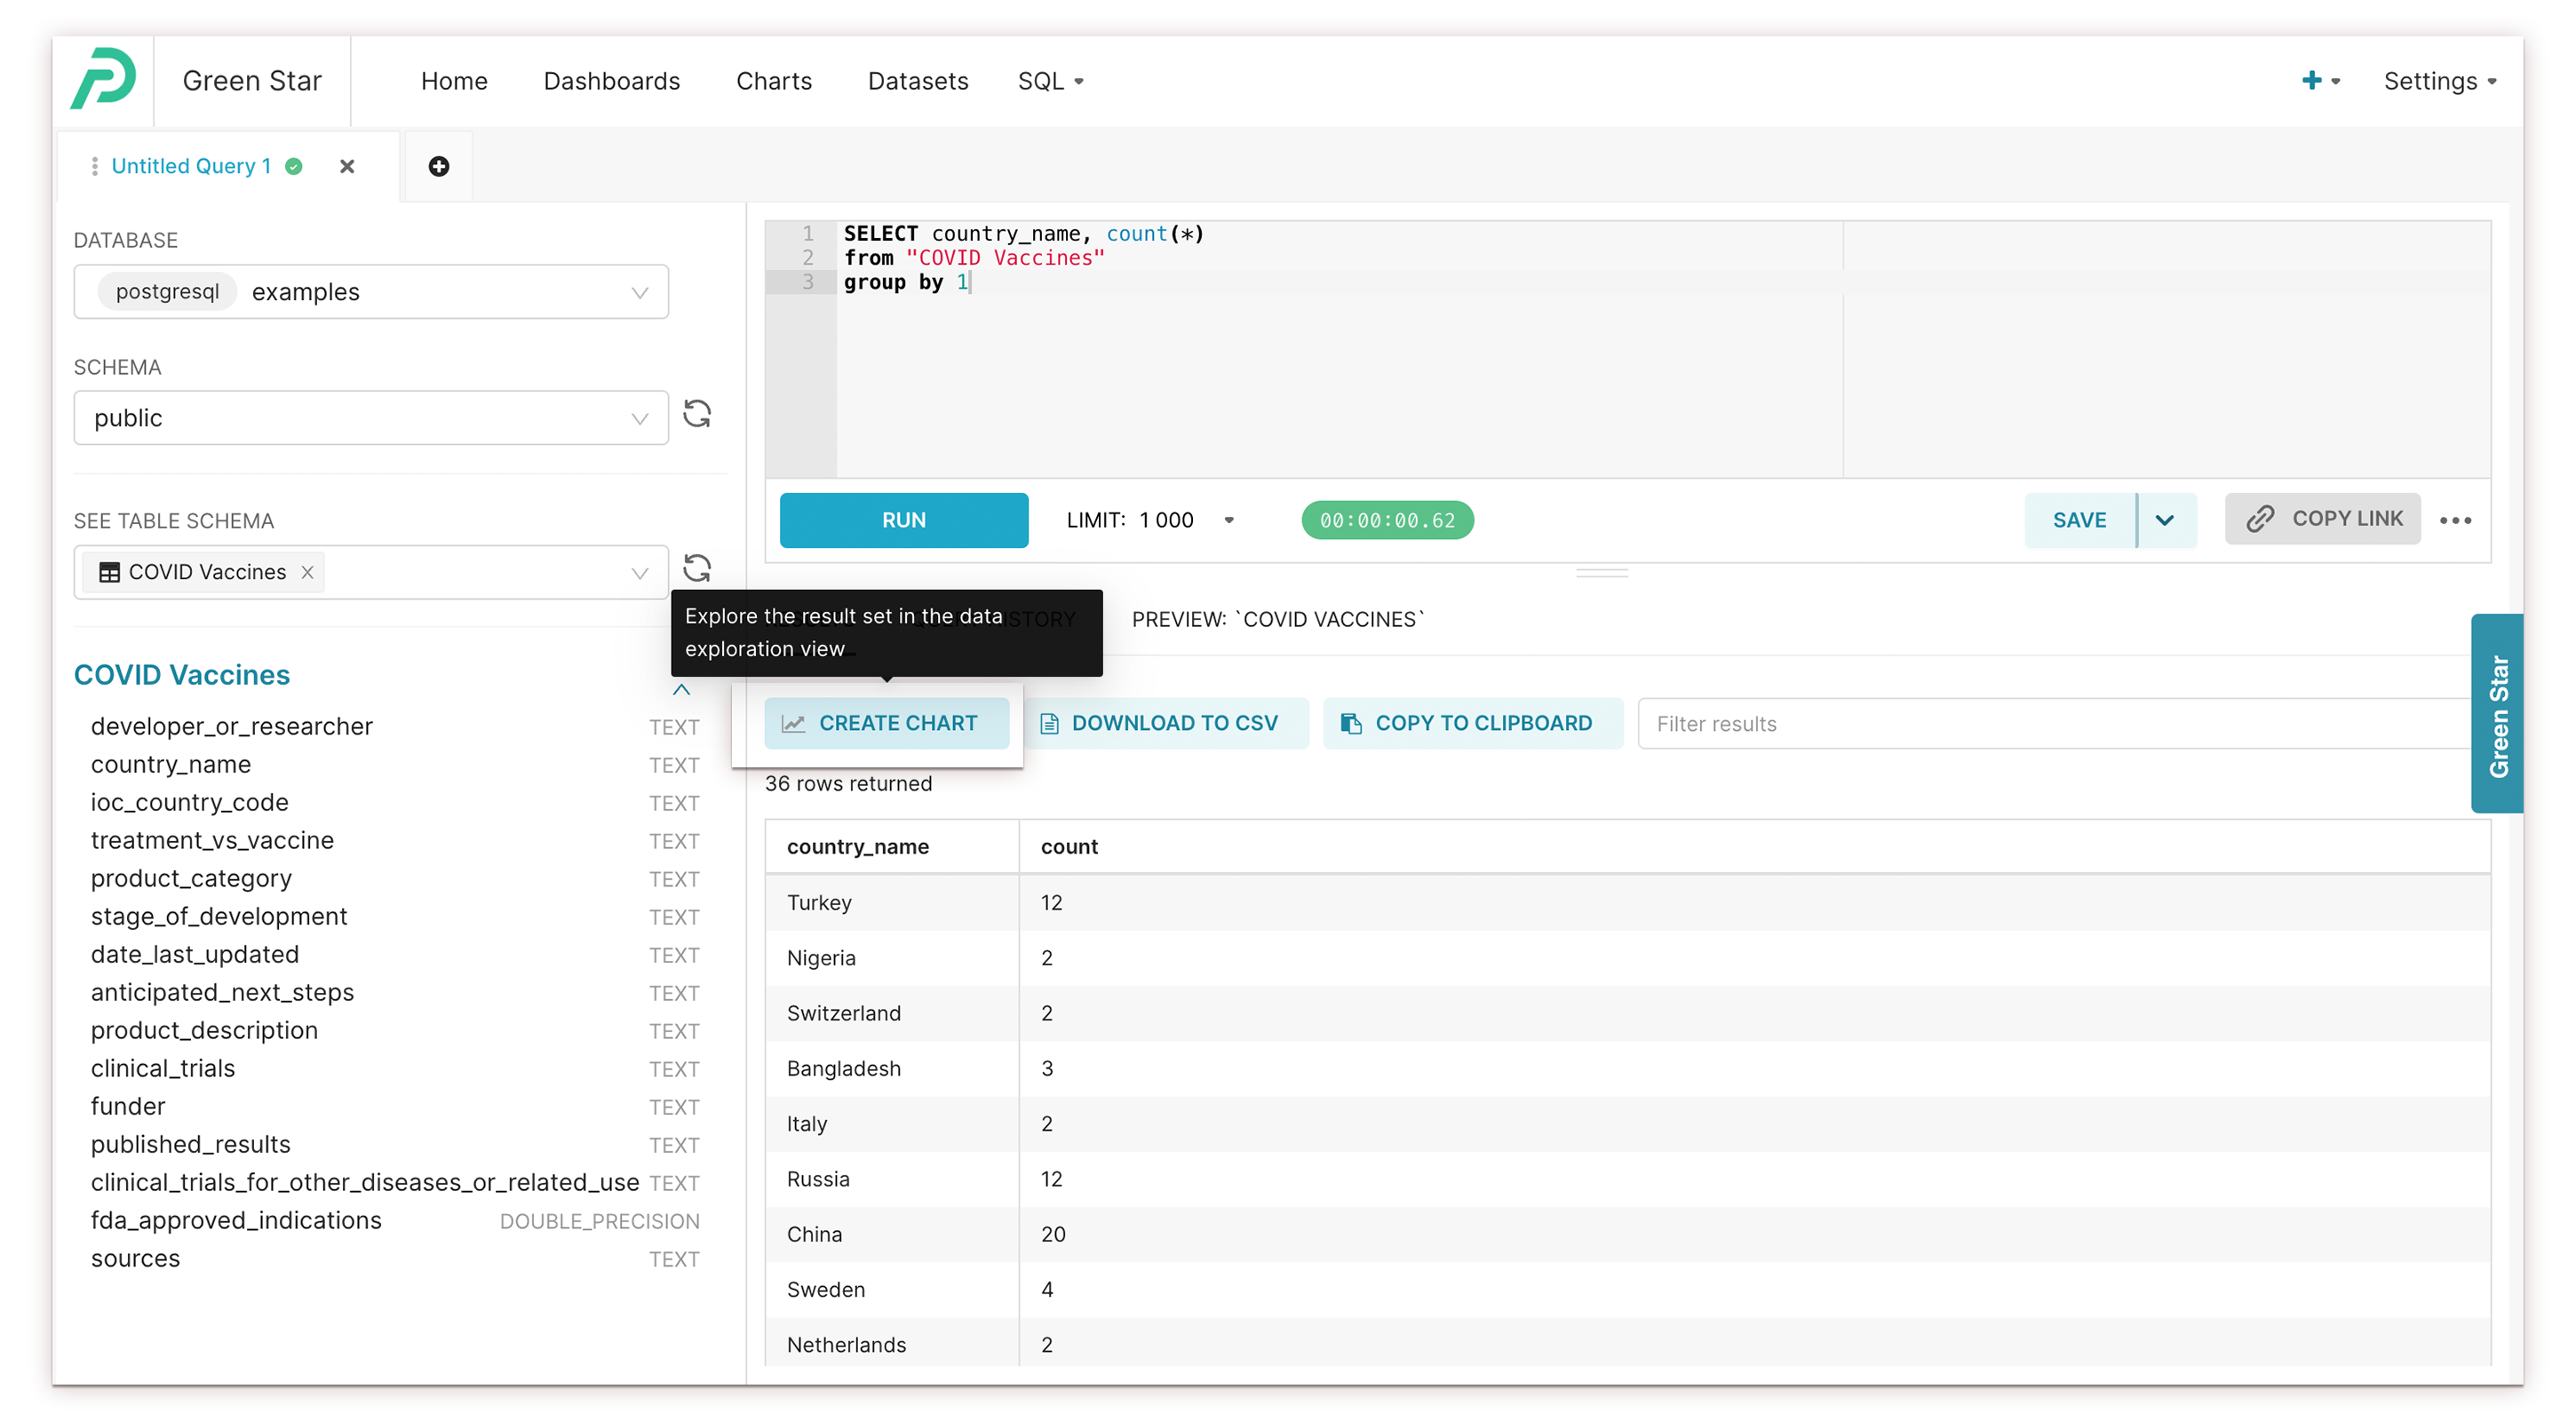
Configure the Chart: Drag entries from the Metrics and Columns panel into the Configuration panel.
Next Steps
Learn more about configuring your chart in the Chart Builder.
Review chart walkthroughs for example implementations.
Add your finished chart to a dashboard to combine it with related charts.
Reminder: L2L Analytics data refreshes daily at 7 AM UTC. For up-to-the-minute data, use the reports available within L2L.