Execution AI: Default Solvers
Last updated: August 26, 2026
Understanding Analysis Solvers
Maximize your Dispatch data with AI-powered insights.
Analysis Solvers use Natural Language Processing (NLP) to scan up to 10000 Dispatch records instantly. Instead of digging through history logs, use these predefined "prompts" to get actionable summaries on machine health, program effectiveness, and downtime causes.
🛠 Available Solvers
1. Machine Analysis Solver
Best for: Maintenance Managers focusing on specific asset health.
What it does: Provides predictive insights to prevent breakdowns before they happen.
Key Outputs: Asset health risk levels (High/Med/Low), Top 3 failure trends, Estimated Time to Failure (ETF), and undiagnosed issues.


2. PM Effectiveness Analysis Solver
Best for: Maintenance Managers evaluating their Preventative Maintenance program.
What it does: Determines if your PM schedule is actually working or if tasks need adjustment.
Key Outputs: PM compliance scoring, lagging indicators, and specific suggestions to improve reliability.
3. OA Impact Analysis Solver
Best for: Operations and Production Managers.
What it does: Analyzes factors impacting Overall Availability (OA) for a specific production line.
Key Outputs: Top 5 critical dispatches, diagnostic summaries of downtime, and root cause analysis (e.g., training gaps or scheduling issues).
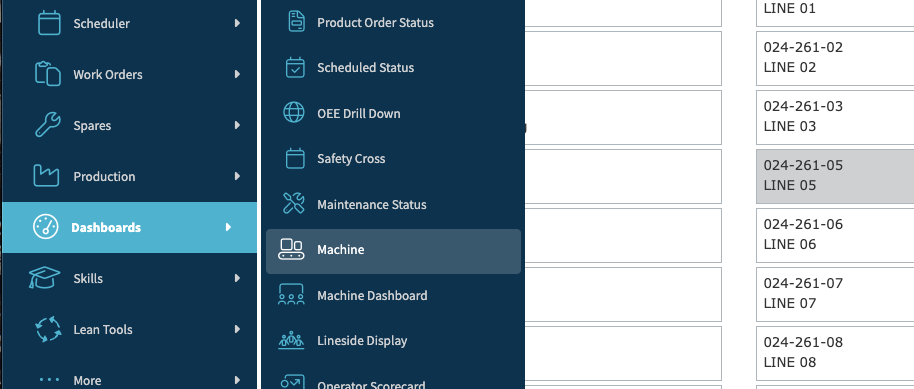
Navigate to the Line History page by:
Clicking on the Line Hyperlink in the Tech Portal or Classic Dispatch view.

4. Failure Pattern Analysis Solver
Best for: Technicians at the machine.
What it does: Summarizes recent actions taken on a machine so technicians don't waste time on redundant troubleshooting.
Key Outputs: Recent intervention history and recurring failure patterns.
You can find this Solver on the Machine History page or the Dispatch History Report.
5. Dispatch Summary Solver
Best for: Portal users
What it does: At a glance view of assigned tasks and high priority items. Restricted to the 15 dispatches on the page.
Key Outputs: Quickly identify "Code Red" dispatches and urgent actions without scrolling through lists.
6. Spares Analysis Solver
Best for: Maintenance Managers
What it does: Analyzes spare parts transaction data from the Spares History Report to surface spending patterns, cost drivers, consumption anomalies, asset reliability risks, maintenance trends, and inventory health — without manually reviewing raw logs.
Key Outputs:
Snapshot of total transactions, spend, and activity spikes
Top cost-driving parts: Helps you prioritize process changes or supplier negotiations for the biggest impact.
Unusual consumption patterns (red flag and one-and-done) and repeat-usage flags
Asset-to-part correlations highlighting potential reliability issues: Helps identify underlying mechanical issues rather than normal wear, as repeated consumption of the same part on the same asset often points to a deeper problem.
Planned vs. reactive maintenance spend insights
Stockout risks and dead stock candidates
You can find this solver by navigating to the Spares History Report
7. Line Pulse Check
Who is it Best For?
The Line Pulse Check is tailor-made for Line Supervisors, Production Managers, and Team Leads who need an immediate, accurate pulse on shop floor health. Whether you are prepping for a line-level tier meeting or stepping onto the floor for a shift handover, this tool eliminates the need to dig through multiple dashboards to piece together what is happening right now.
Key Outputs & Insights
When a supervisor triggers the Line Pulse Check from the lines widget on the role-based homepage, the AI instantly analyzes current shift data, historical patterns, and active events to deliver a concise, actionable summary. Key outputs include:
Shift Performance & Targets: An instant snapshot of your actual production numbers against goals, current staffing statuses, and overall shift health.
Micro-Stop & Speed Loss Tracking: Identification of hidden efficiency killers—like micro-stops and speed losses—before they accumulate into massive downtime events.
Active Issue (Dispatch) Summaries: A direct look at critical Code Red or Code Yellow events requiring immediate attention.
Shift Handover Actions & Verdicts: A quick "pulse verdict" accompanied by clear, recommended actions to ensure seamless transitions between shifts.
You can find this Solver in the lines widget on the role-based homepage or the Operator Portal.
8. Shift Handover Solver
Who It Is Best For
The Shift Handover Solver is designed for operational teams and leaders who need fast, actionable clarity during shift changes:
Shift Supervisors & Line Managers: Perfect for running efficient Tier 1 meetings without spending pre-shift time manually compiling performance reports.
Cross-Functional Stakeholders: Quality managers, maintenance leads, and plant managers can quickly align on line health and ongoing friction points.
Production Operators: Gives incoming operators immediate context regarding performance and pending tasks the moment they step onto the floor.
Key Outputs You'll Receive
When the Shift Handover Solver runs within the ExecutionAI Chatbot, it delivers three core insights based on the previous shift's data:
Executive Overview: A high-level summary of performance, giving you an instant baseline of how the shift ran.
High-Level Key Issues: A curated look at major operational friction points—such as downtime events, quality hiccups, or maintenance bottlenecks—so nothing gets hidden in the noise.
Recommended Actions: Data-driven, prioritized recommendations tailored for the upcoming shift, ensuring your team knows exactly what to tackle first.
How to Access It: You don't need to manually trigger this summary. If you are assigned to a production line, you will receive a convenient toast notification directly on your Operator Portal 15 minutes before the shift ends. Simply click the notification to launch the ExecutionAI Chatbot and view your summary. From there, you can even ask follow-up questions (like "tell me more about the downtime event") to dig deeper into specific shift details.
🚀 How to Run a Solver
You can access Solvers from the Machine History page, Line History page, or the Dispatch History or Spares History Reports.
Launch Execution AI from the upper right-hand corner of many pages: Home page, Dispatch Portal, Operator Portal, Reports, Line or Machine History pages, etc.
Click the Execution AI button in the upper right corner.

Use the microphone icon in the chat input at the bottom for talk to text.
Select your Solver from the list or create your own prompt:
Standard Run: Click the Solver name to run the predefined prompt.
Custom Run: Click Edit solvers. Enter a custom prompt.
Click Run.
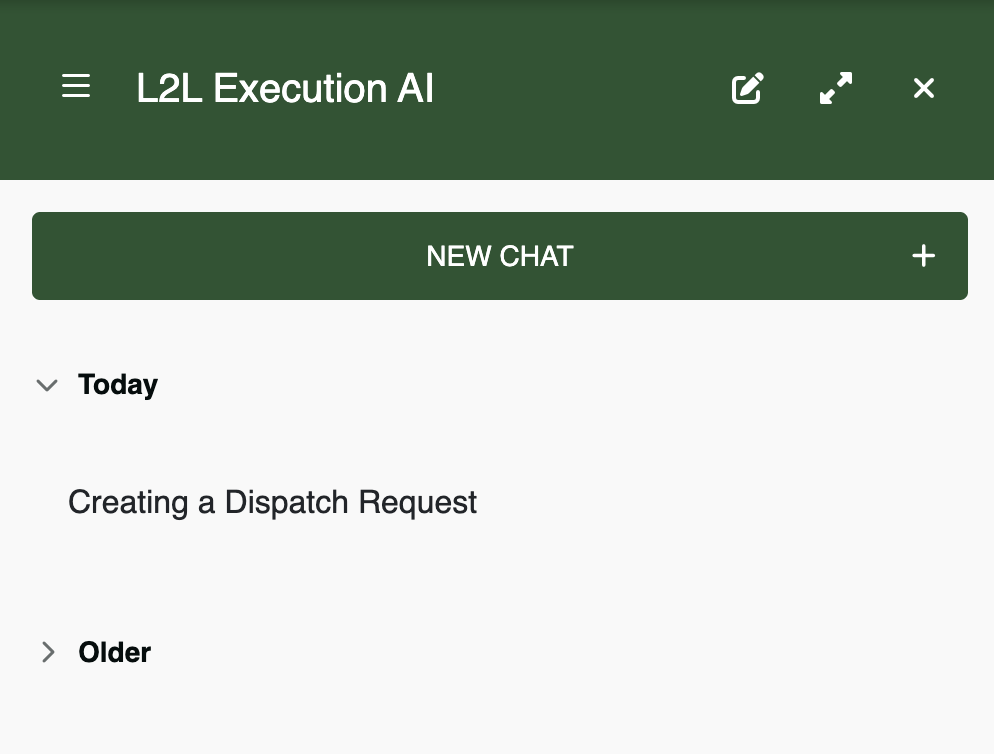
Open the menu icon in the top bar of the L2L Execution AI panel, then select Show History to view, star, hide or rename previous conversations. To return to the standard chat view, open the same menu and select Hide History.
Chat Functionality
Execution AI conversations are retained in chat history, so you can reopen previous conversations from the panel menu when you need to continue a discussion or review earlier responses. You can also star, hide or rename those conversations. Please note that the timestamp in the history reflects UTC time.
You no longer need to select a specific "Solver" to get answers, but you can ask follow up questions to those solvers.
The chat input includes a microphone icon for talk-to-text prompts.
To expand the chat interface, click the Fullscreen icon in the upper-right corner of the chat panel. Click the same icon again to return to the default view.
Ad-Hoc Questions: Open a blank chat and ask anything about your Dispatch data (e.g., "What were the most common issues this week?").
Follow-up Support: Keep the conversation going! You can dig deeper by asking, "How much downtime did those specific issues cause?" or "Which parts were replaced during those fixes?"
💡 Tips for Success
Copy & Share: Use the Paper Icon (bottom left of results) to copy the analysis to your clipboard for emails or reports.
Feedback Loop: Use the Thumbs Up/Down icons to let us know if the analysis was accurate. This helps improve the AI.
Multi-Language Support: Want results in another language? Write your custom prompt in that language, and the AI will respond in kind.
Be Specific: If using the Advanced mode, ask for "Top 3 causes" rather than "What is wrong?" to get clearer results.
Spoken Prompts: Use the microphone icon when speaking a prompt is faster than typing.
Ask for Priorities: Try asking, "Which of my assigned dispatches should I tackle first to reduce the most downtime?"
Share Custom Solvers: https://support.leading2lean.com/hc/en-us/articles/45469916077581-Setup-L2L-Execution-AI-Solver-Management
Identify Gaps: Ask, "Are there any patterns in the dispatches I missed last week?"
Ask L2L Support to increase your Dispatch limit up to 10k today!