Kaizen Trend Report
Last updated: June 19, 2026
The Kaizen Trend report provides valuable data to help you manage Kaizens for your plant.
Filters
- Area: Areas that a Kaizen is linked to.
- Line: Lines that a Kaizen is linked to.
- Start Date/End Date: Date range to consider for kaizens created, or completed. See metrics below.
- Basis: Report data by Week or by Month
- Head Count: Number of people in a facility. The Head Count is used in the Per Person metric below.
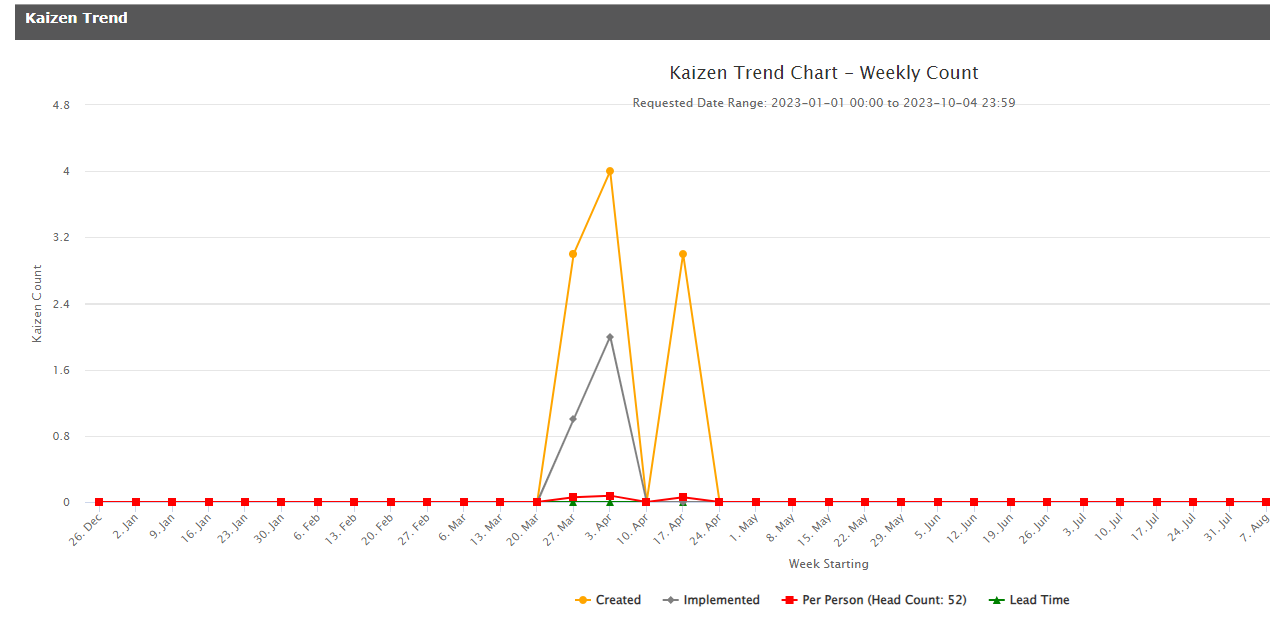
Metrics
- Created: Total number of Kaizens submitted within the date range.
- Implemented: Total number of Kaizens completed and closed within the date range. Of note, if for example a kaizen was created in January but not completed or closed until March, that kaizen is included in the implemented total under the March date.
- Per Person: Total number of Kaizens submitted within the date range/headcount
- Lead Time: Lead time of Kaizens completed within the date range. Lead time is the total number of days it took for a Kaizen to be completed, starting from the date the Kaizen was submitted.