OEE Dashboard (OEE Drill Down)
Last updated: November 18, 2026
The OEE Dashboard (OEE Drill Down) is a quick way to view the OEE for your site across a week or a month time frame. The dashboard is also useful to compare the OEE of all sites within your company in one location.
You'll notice 'Filters' at the top of the page. The filters allow you to select or unselect sites that you don't wish to see in the Overall metric. The filter also lets you select a date range. Notice you can't go back more than 1 month. Additionally, once you have drilled down, you can use the arrow up to go back to the upper level (Drilled down to Lines, Arrow brings you back up to Areas)


Next, you'll find the OEE trend. The trend chart shows a week-to-week or day-to-day comparison of OEE for all sites or for the specific site you are drilled into.

The OEE metric is calculated using Availability, Quality, and Performance. The Dashboard gives you a glimpse at each of these metrics as well as the Overall OEE for all sites within your company. You can click into the Site, Area, and Line.

From the Site, Area, or Line level, you can drill into each of the metrics to pull up a Report in another window.
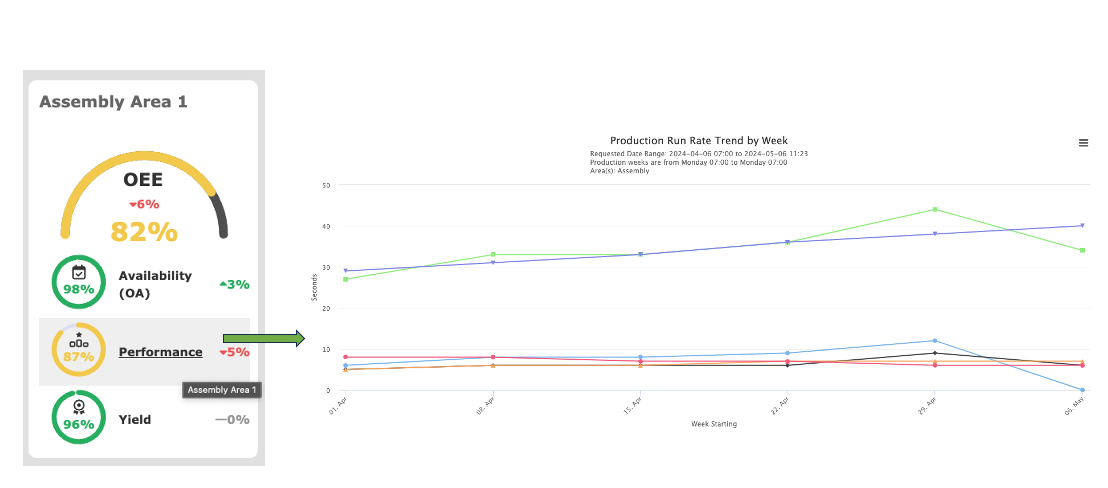
The Performance metric will pull up the Production Run Rate Trend. Click here for more information on the Performance metric.
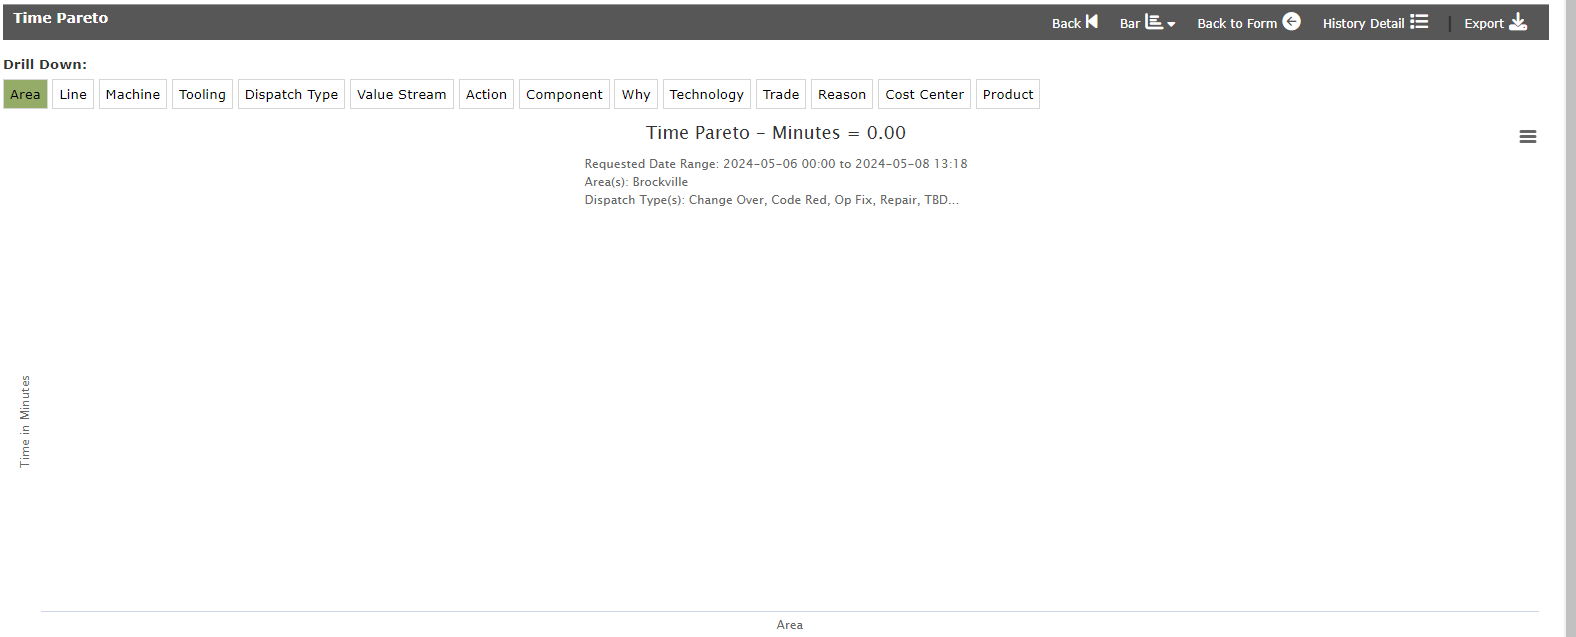
The OA Metric will pull up the Time Pareto Chart. Click here for more information on the OA Metric.

The Yield Metric will pull up the Production Run Rate Trend by Day. For more information on the Quality/Yield Metric click here.


Note: Metrics may appear off if: 1. You don't have threshold standards implemented across all sites. 2. Production start-up times differ for sites across the globe.
It is possible to have a higher OEE for the site even if all the areas making up the site have smaller OEE values. The spreadsheet screenshot below shows the Area and Line level, but the same principle applies at the Site and Area level.
For example, Areas 1 and 2 have two lines each that are set up exactly the same, except for the cycle time and actuals. Note that those values are different for the lines in Area 1, but match for the lines in Area 2.
The OA, Quality, Performance, and OEE metrics match exactly for Line 1 and Line 3 as well as Line 2 and Line 4, but notice that the metrics for Area 1 and Area 2 don't match. The Area 1 OEE (U15) is higher than Area 2 (U18). It's also higher than the OEE for its constituents, Line 1 and Line 2 (U16 and U17). This is due to the different cycle times.
The smaller cycle time on Line 1 means that the actuals and theoretical parts will be proportionally much larger than on Line 2. This mathematically gives a stronger influence to the Performance of Line 1 when used in the calculation for Area 1's OEE. When the cycle times are the same as for Area 2, the Area OEE is between the OEE for its lines as the customer expects.

If you can't see the OEE dashboard for your site, 1. You must be using the Production Module.
OEE Reporting Performance Limits for Long Date Ranges
Some customers may see the standard OEE report load for a long time, return an error, or fail to complete when they run it across a very large date range such as a full year.
What to expect
Very long date ranges can exceed what the standard OEE report can reliably process.
This is most likely to happen when reporting across many assets or over a full-year range.
Workaround
Run the report in smaller date ranges and combine the results outside of L2L if needed.
For example, instead of running one report for January 1 through December 31, run:
January 1 through June 30
July 1 through December 31
If a six-month range is still too large for your data set, reduce the range further and run the report in smaller segments.
When to use this approach
Use this workaround any time a long-range OEE report:
keeps loading without returning results
returns an error
fails only when the selected date range is very large
Additional note
At this time, the recommended path for long historical OEE reporting in the standard report is to use smaller date ranges rather than a single year-long run.