OEE Metric
Last updated: July 13, 2026
OEE (Overall Equipment Effectiveness) is a metric used to measure the overall efficiency of a manufacturing process. It factors Availability, Quality, and Performance into the final calculation.
OEE Setup
Define Cycle Times: Cycle times must be defined for the OEE metric to calculate properly. Go to Production > Line Cycle Times to set them up.
All Products vs. Specific Products: Cycle times can be set up for All Products or assigned to specific products by Line. If you record a specific Product on a pitch, the system will use that defined Product Cycle Time to calculate OEE.
Active Schedules: Active pitch schedules must be populated within the production module to use the OEE calculation.
Calculation
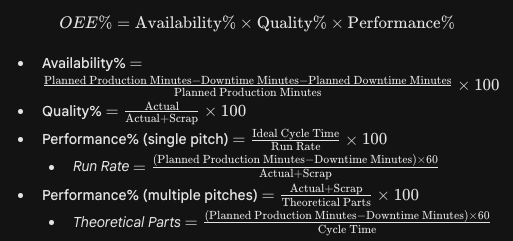
📘 Note on Aggregation: The OEE% calculation is aggregated using raw pitch details rather than a simple multiplication of the final component percentages. This ensures an accurate historical reflection of your data across all dashboards. All active pitches contribute to your metrics when they contain recorded actuals, scrap, or downtime. Pitches without a defined Ideal Cycle Time (ICT) are included in the broader OEE calculations and are no longer silently excluded.
Helpful Tips
Hourly Tracking: The Pitch board view within the operator portal is an excellent way to monitor your OEE metrics on an hourly basis.
Troubleshooting Zeroes: If your OEE metric is showing 0%, you are likely missing one of the primary metric variables. Review your Line Cycle Time Settings for that specific line.
Inflated Performance: If a line runs faster than its defined cycle time, the Performance metric (and consequently the OEE) will exceed 100%. We encourage you to regularly audit and update your standard cycle times to prevent artificial inflation.
Downtime Calculations: Downtime is captured using data from "Down" Dispatches.
Non-Production Pitches: If a machine goes down during a pitch scheduled for non-production minutes, downtime is calculated for the entire duration of that pitch. To avoid this, break your schedules into dedicated production pitches and inactive non-production pitches.
OEE Pareto Report vs. OEE Trend Report: The OEE Pareto Report utilizes the precision values configured directly within the OEE metric settings (e.g., displaying to
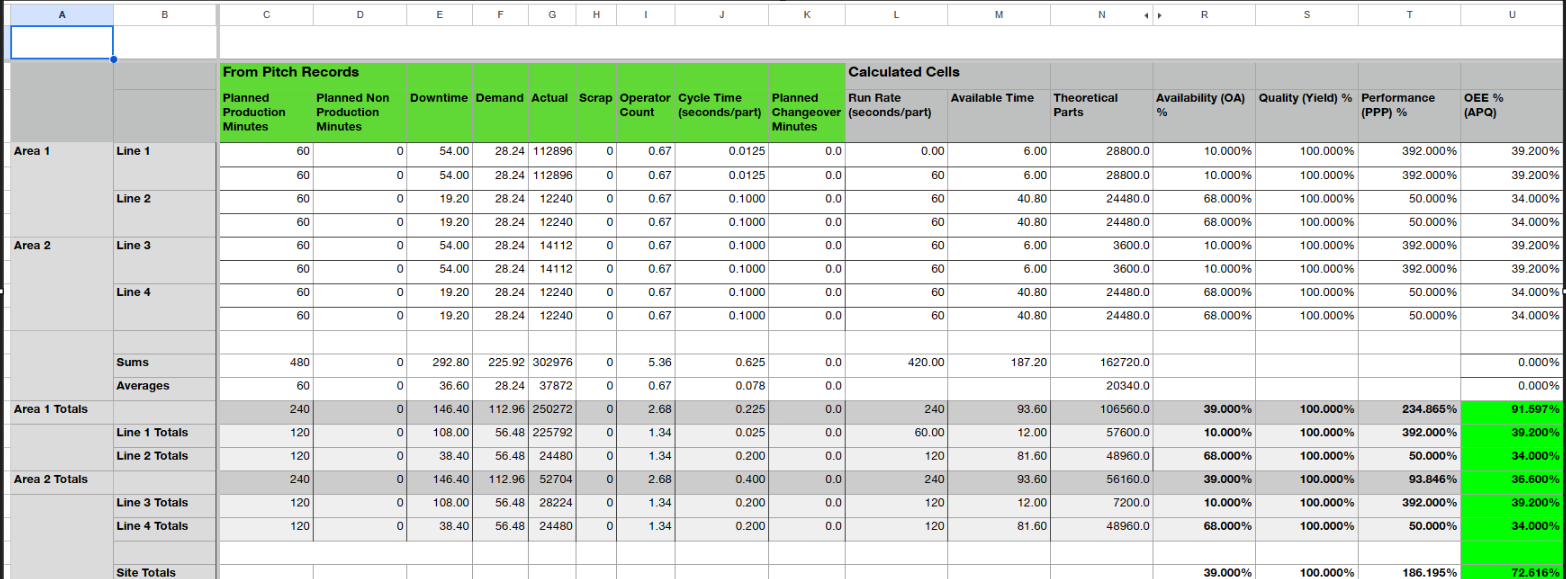
.1decimal precision). Conversely, the OEE Trend Report references individual precision configurations specified by the customer in general Production Settings (which default to whole numbers). Because both reports now uniformly aggregate raw pitch data without excluding missing-ICT pitches, any remaining minor variances are strictly due to these configured decimal precision settings.Understanding Site-Level vs. Area-Level OEE: It is mathematically possible to have a higher OEE at the site level than the individual averages of the areas making up that site. This happens when different lines have vastly different cycle times. A smaller cycle time means that actuals and theoretical parts are proportionally much larger, giving that specific line a stronger mathematical weight when aggregated into the higher-level site metric.
Related Links
Attachments:
OEE_Calculations.xlsx